
Sprint Burndown Chart - what it is, how to create it and successfully use this tool in practice
Sprint Burndown Chart is the most common tool for Scrum and Agile teams which work on iterations. Even though it is simple and powerful tool a lot of teams struggle to deeply understand the information behind their Sprint Burndown Chart. We noticed that one of the reason is that they raly on automatic tools to create it. This blog post aims to explain in detail how to compile your Burndown Chart - how to extract the necessary information and when and how to update the chart.
24 Aug 2020Usually, the Burndown Chart is used by teams to track their progress during the sprint.
One of the main things we work with teams on is how to properly organize and manage their Sprint Backlog and how to use the Sprint Burndown Chart daily in their work. There are two aspects - first how to compose it correctly and then how to analyze it. In this article we will show in detail how to compile your Burndown Chart - how to extract the necessary information and when to update the chart.
Why for tracking progress during a Sprint is the Burndown Chart usually used?
The Burndown Chart is used at the sprint level, because during the Sprint the team does not expect scope changes, ie. they do not expect new requirements from the business - functionalities, tasks, bugs, etc. If this happens, The Burndown Chart will go up, which is unnatural for this type of chart. If you expect scope changes and you want to clearly illustrate this, we recommend using a Burnup Chart, which we will show it you in detail in our next posts.
How to create a Burndown Chart in practice
We need to clarify two things for each type of chart:
- The information it depicts - how and from where to properly extract the data that will be processed.
- The trigger event to update it.
The data for Burndown Chart is taken from the team's Sprint Backlog, and the event to updated it is the team's Daily Standup meeting.
For our purpose, we will work with a team's Sprint Backlog and we will monitor the change that occurs daily.
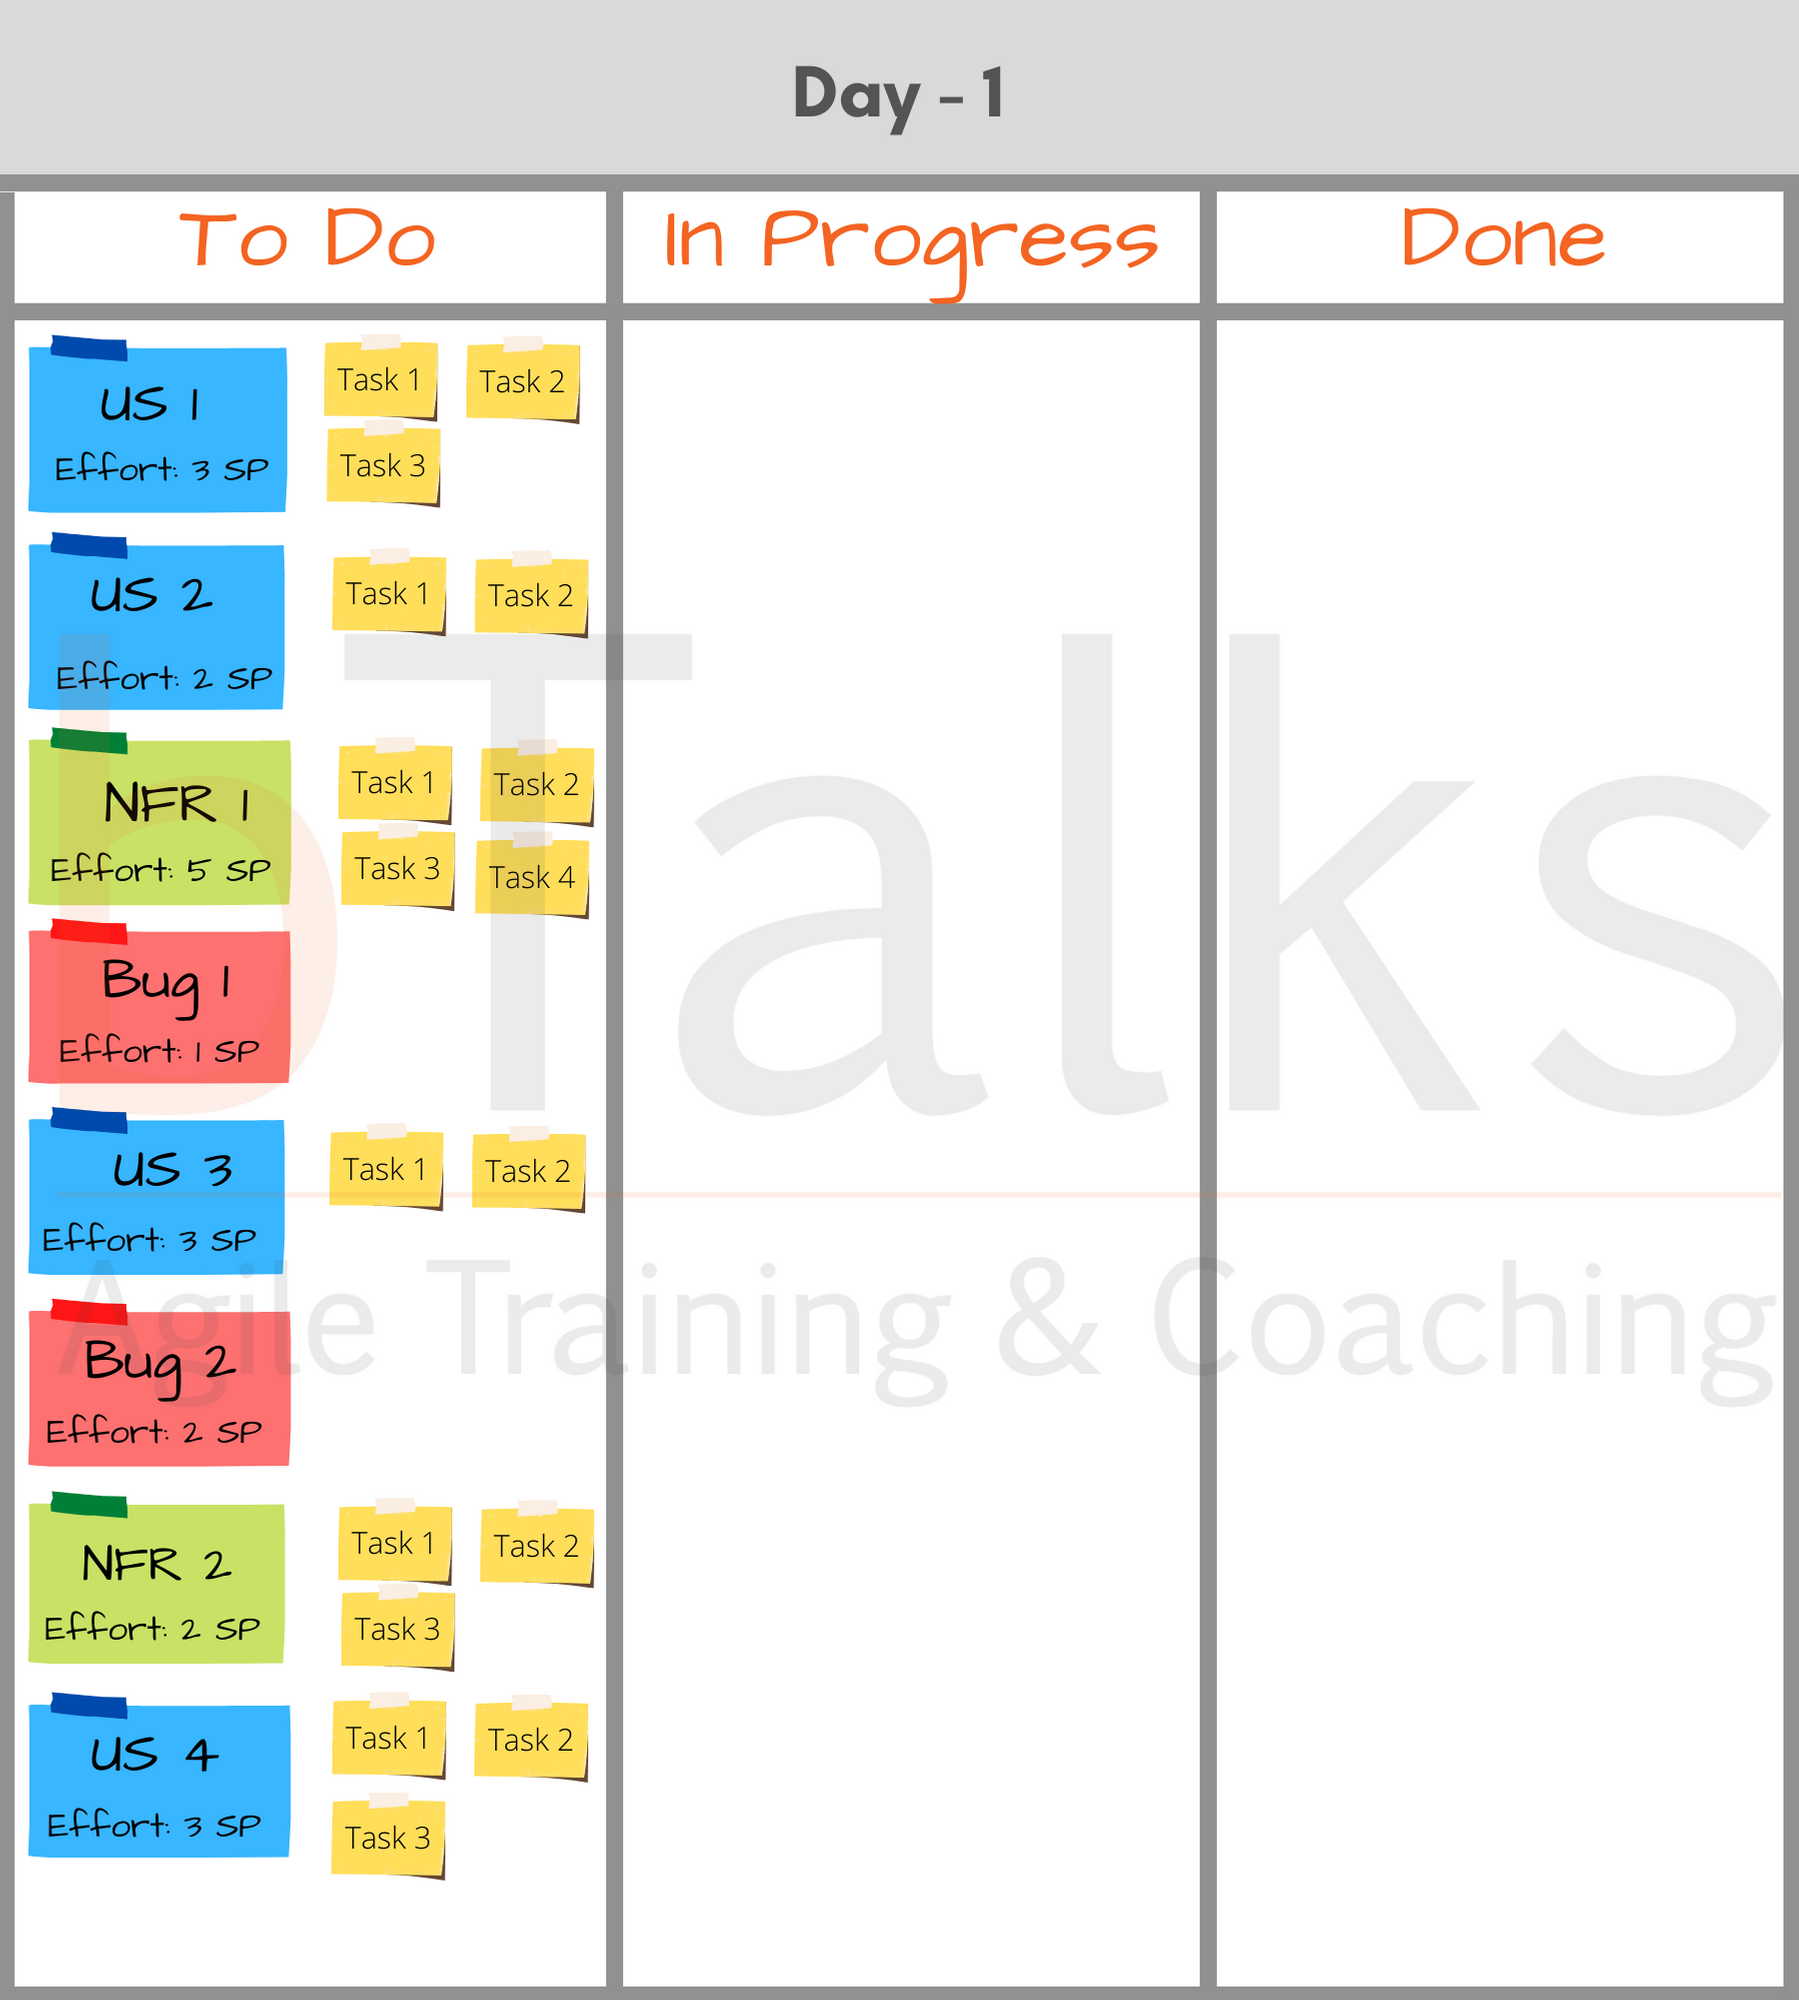


On the pictures above, you can see a snapshot of the team's Sprint Backlog at the end of each Daily Standup meeting during a two-week sprint. We have all the necessary information. Before proceeding, please download this template, if possible, print it so that you can work with the following explanations. If you are familiar with Sprint Burndown Chart, you can first try to draw it based on the information you have (daily snapshots of a team's Sprint Backlog).
When is the Sprint Backlog created?
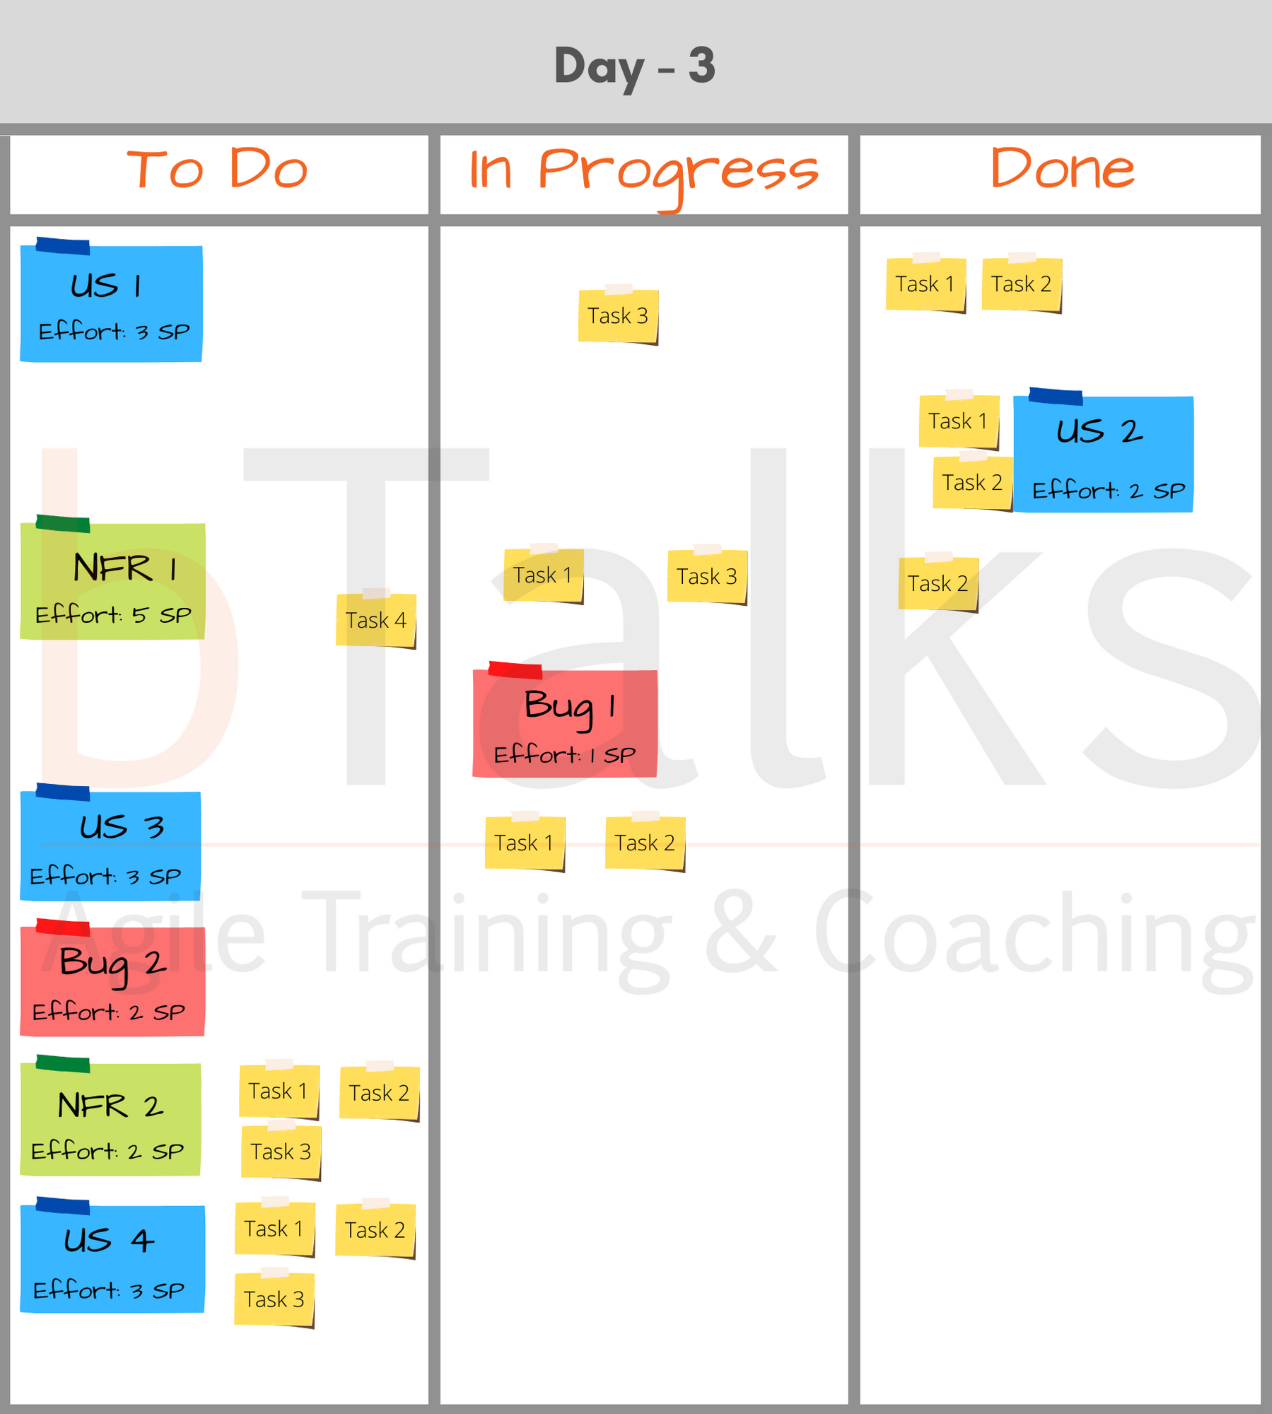
The Sprint Backlog is created during the Sprint Planning meeting and it contains the entire work that the team commits to get done within the next Sprint. In our case, the Sprint Backlog contains 4 User Stories (blue), 2 Bugs (red), 2 Non-Functional Requirements (green). Below each item you see the Effort estimated in Story Points.
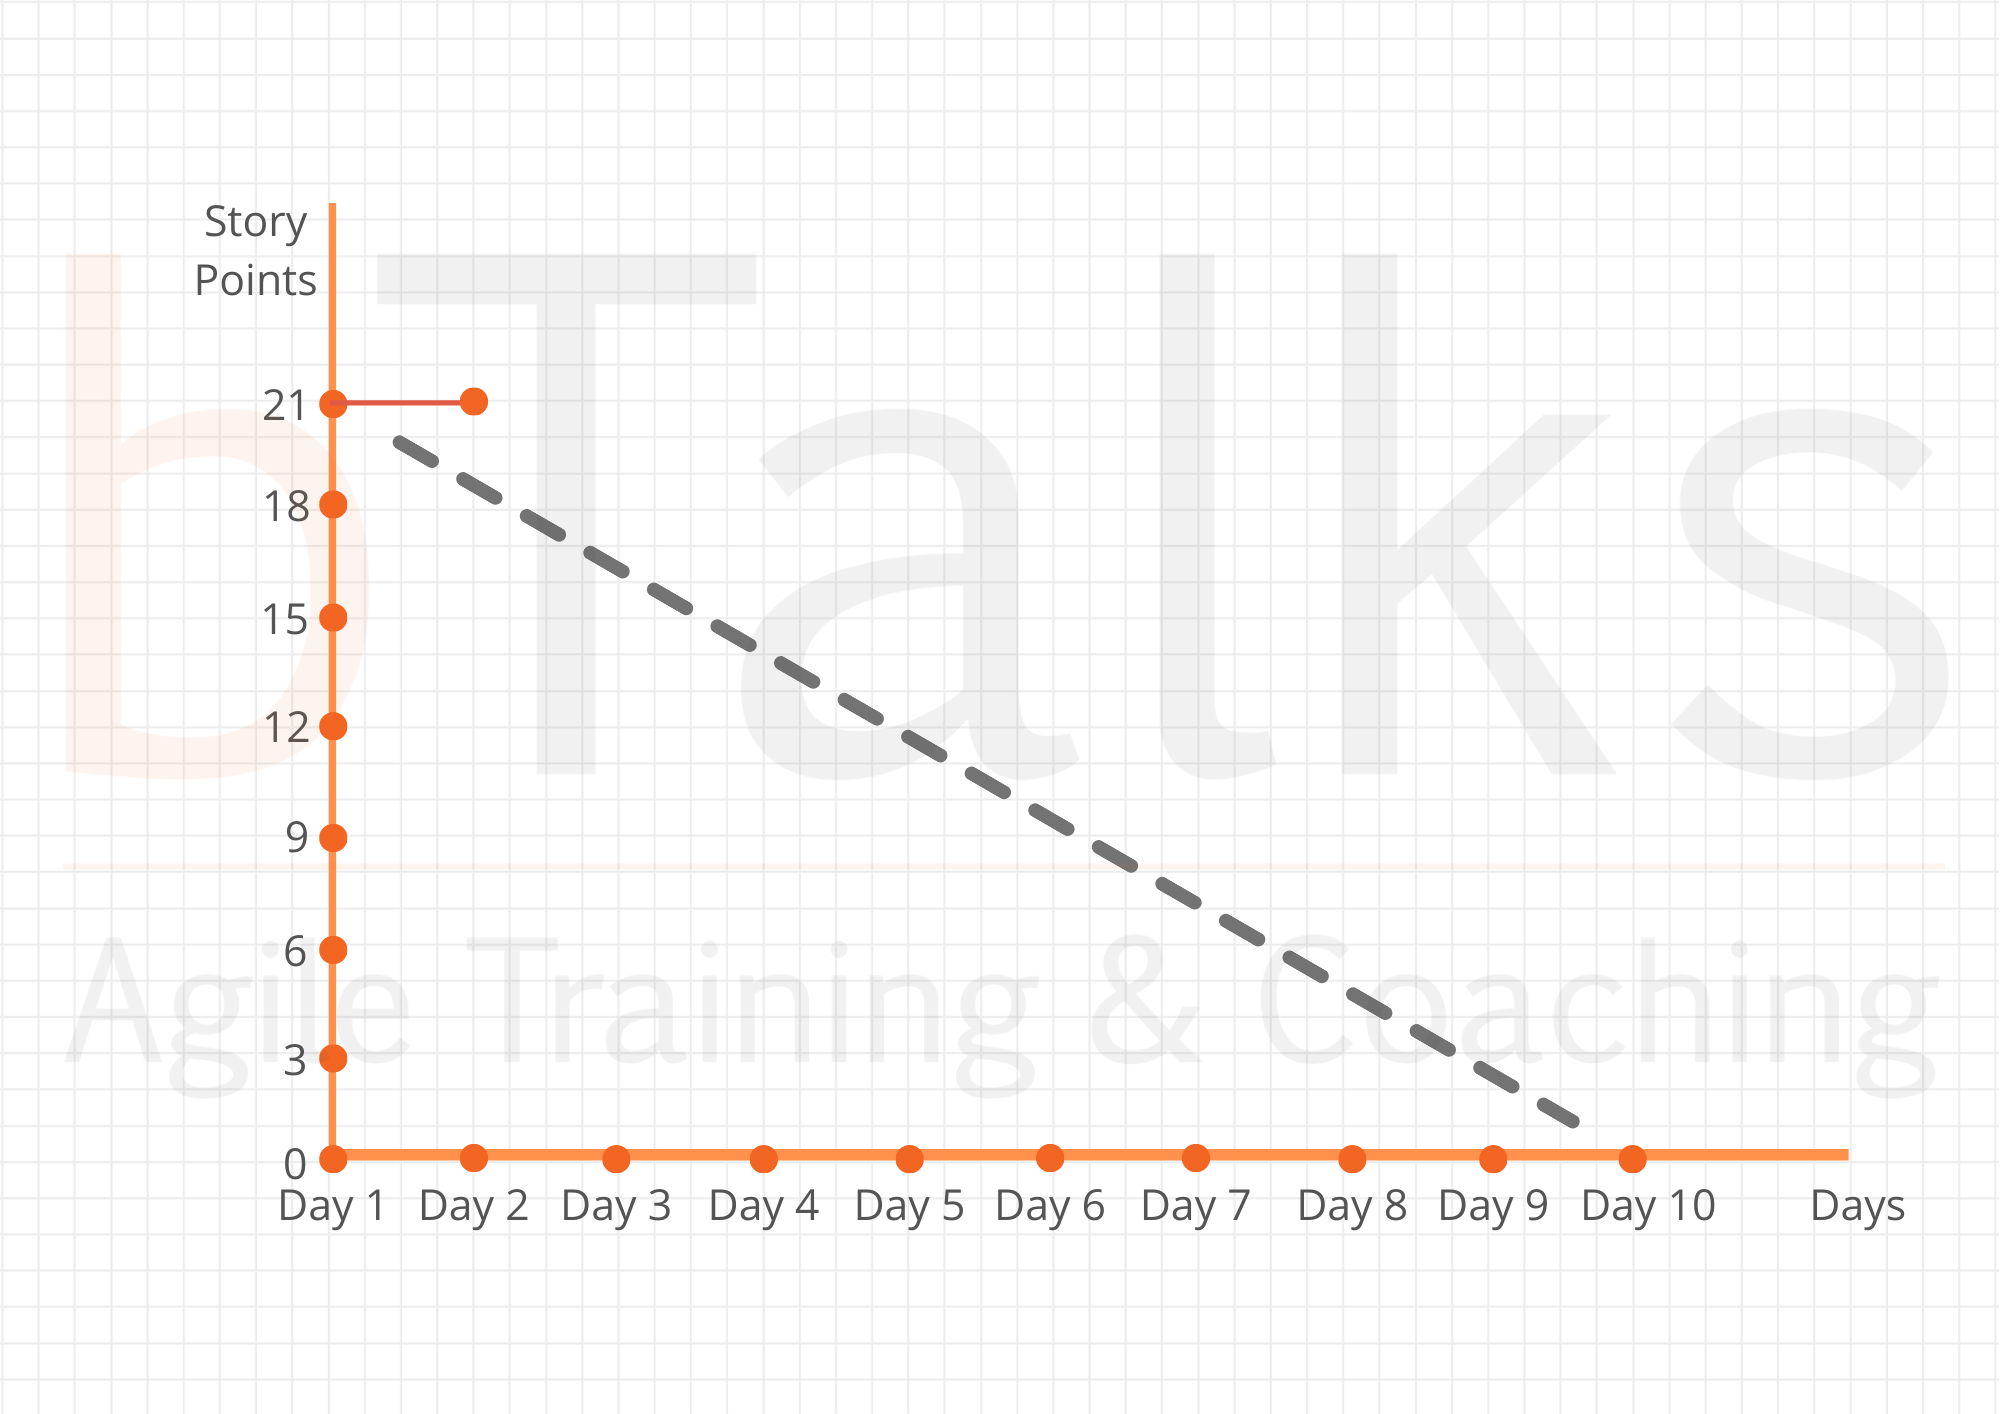
At the end of the Sprint Planning meeting, the team creates the frame of the Burndown Chart.

The two parameters needed are the amount of work the team committed to complete (the total amount of Story Points for the next sprint is 21, we place them on Y-axis) and the number of days (in this case a two-week sprint with 10 working days, we place them on X-axis).
One important feature - the point zero of the X-axis is Day 1, because the first day of the Sprint the team does not have a Daily Standup meeting (or it actually happens immediately after the Sprint Planning meeting and the team start working). For this reason, it is not possible for the team to have marked anything ready on the first day.
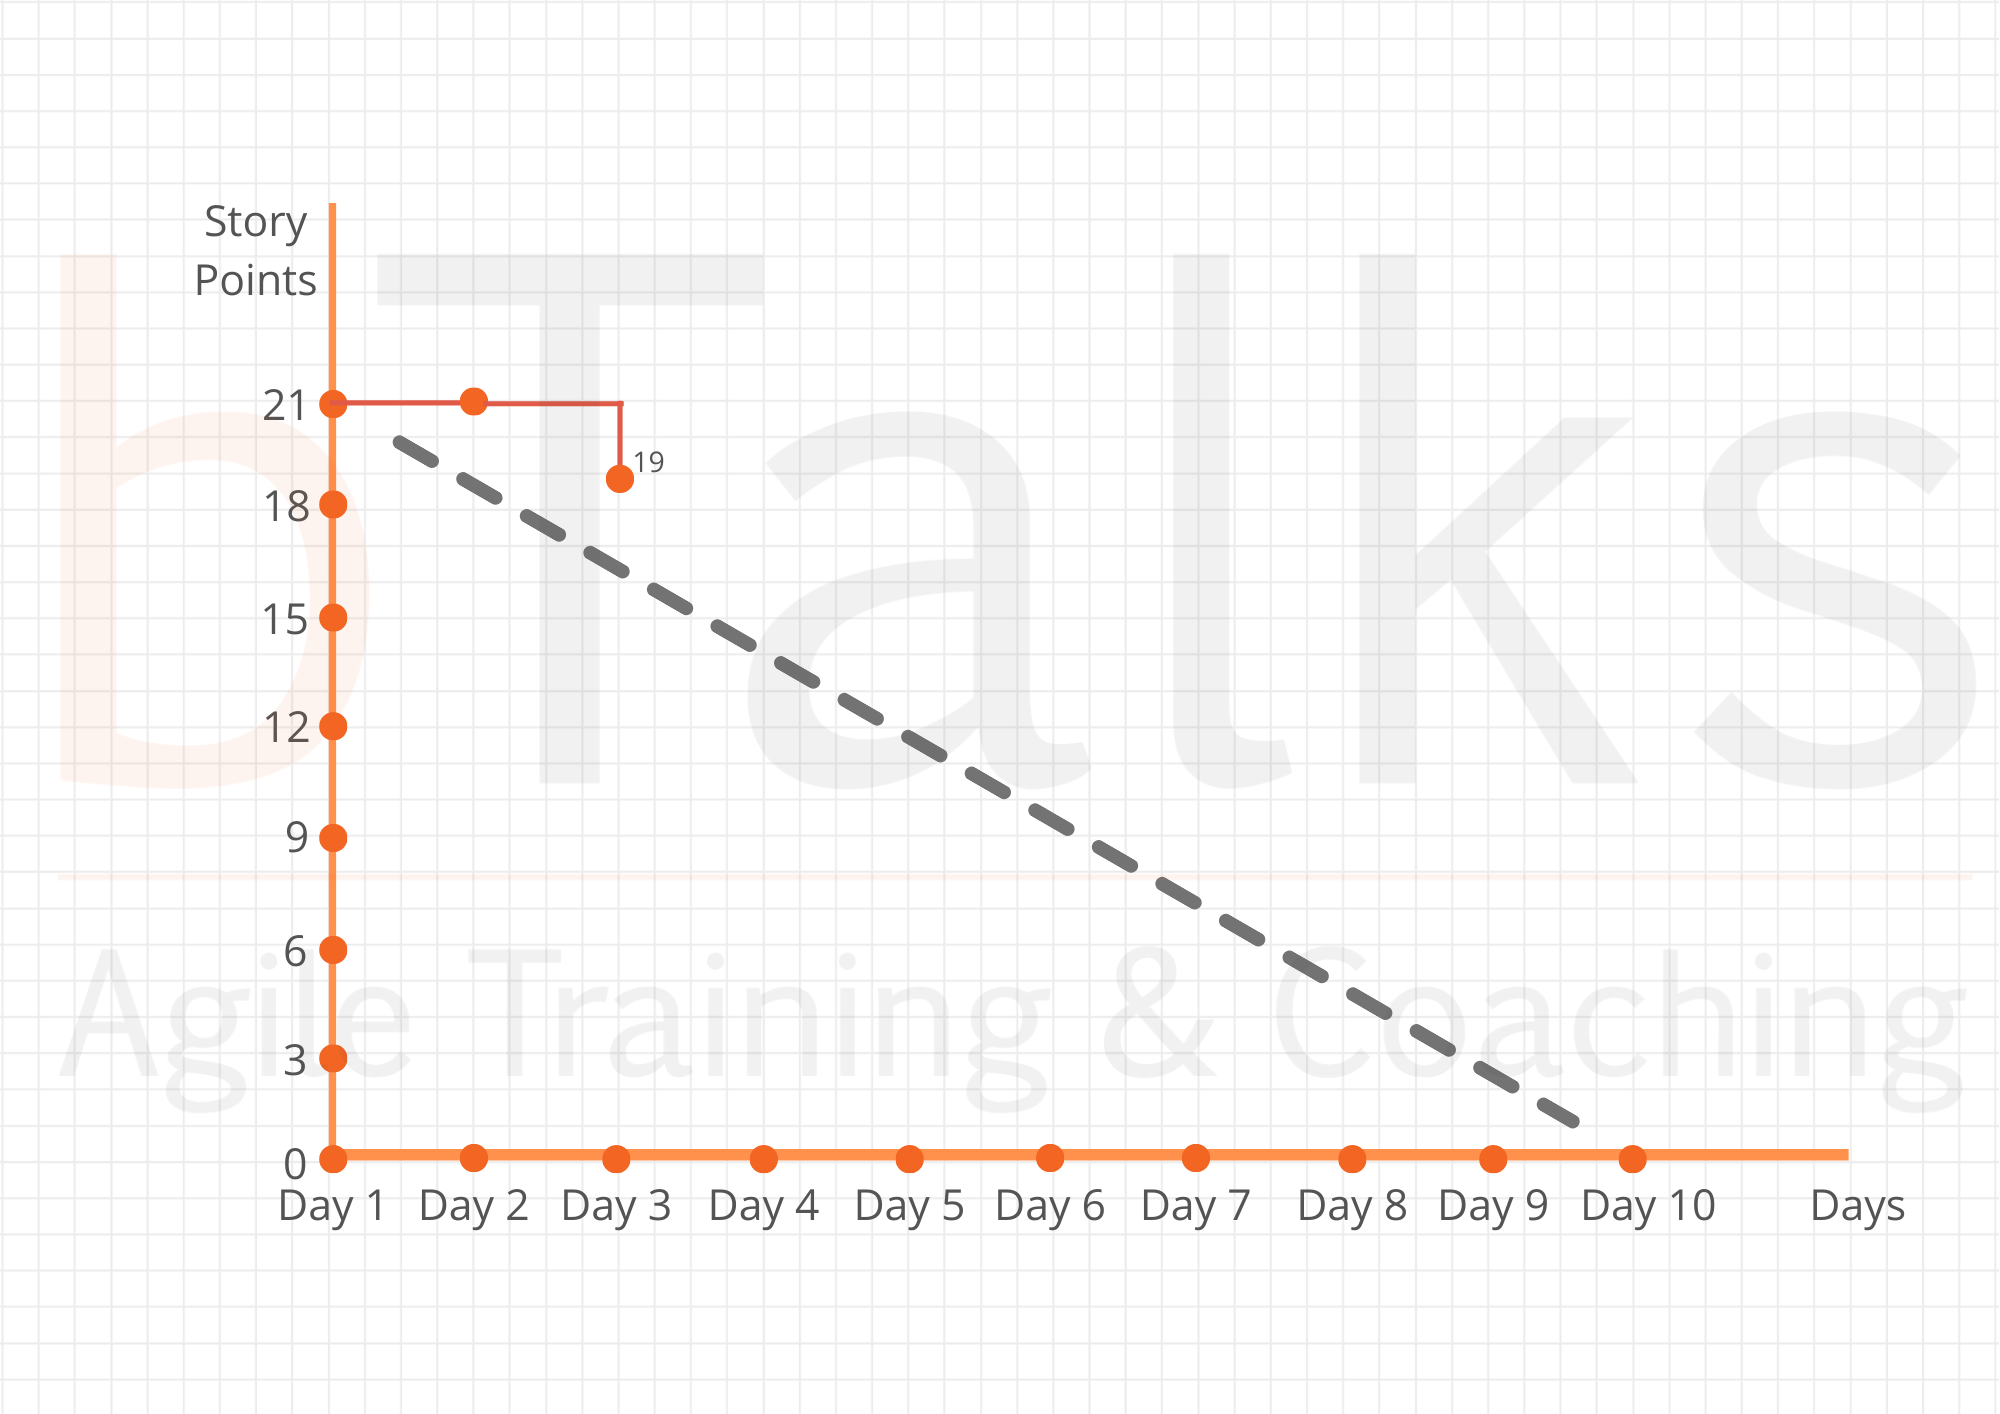
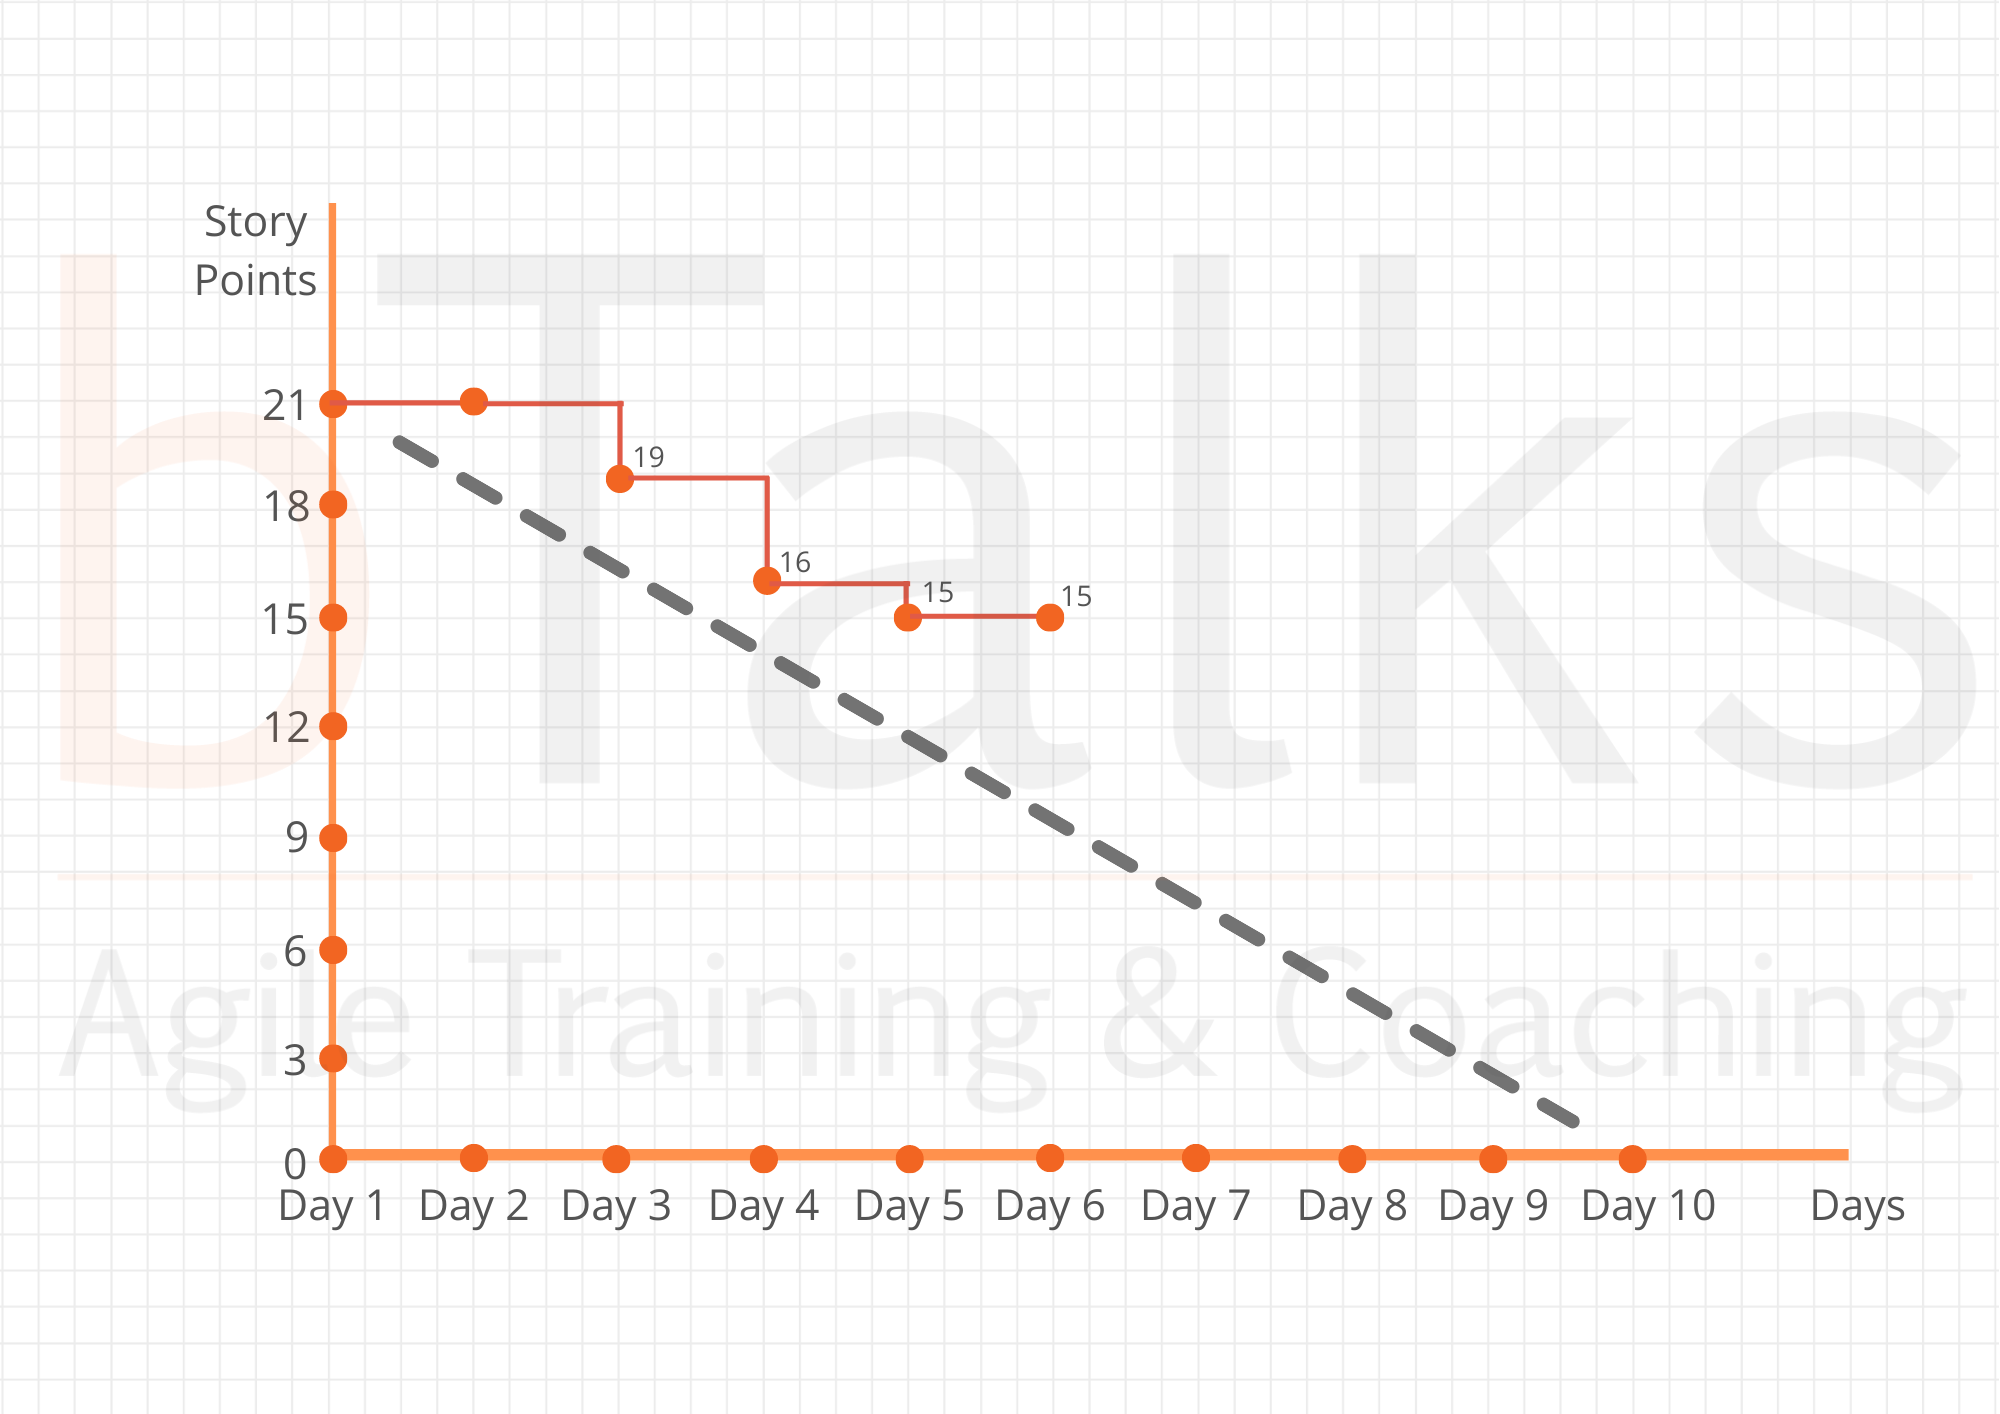
The second day follows. At the end of the Daily Standup, the Sprint Backlog must always be up to date. After the meeting, the team marks the current situation on their Burndown Chart. In our case, on the second day of their Sprint, the team did not mark anything as done. Their Burndown Chart looks like this:
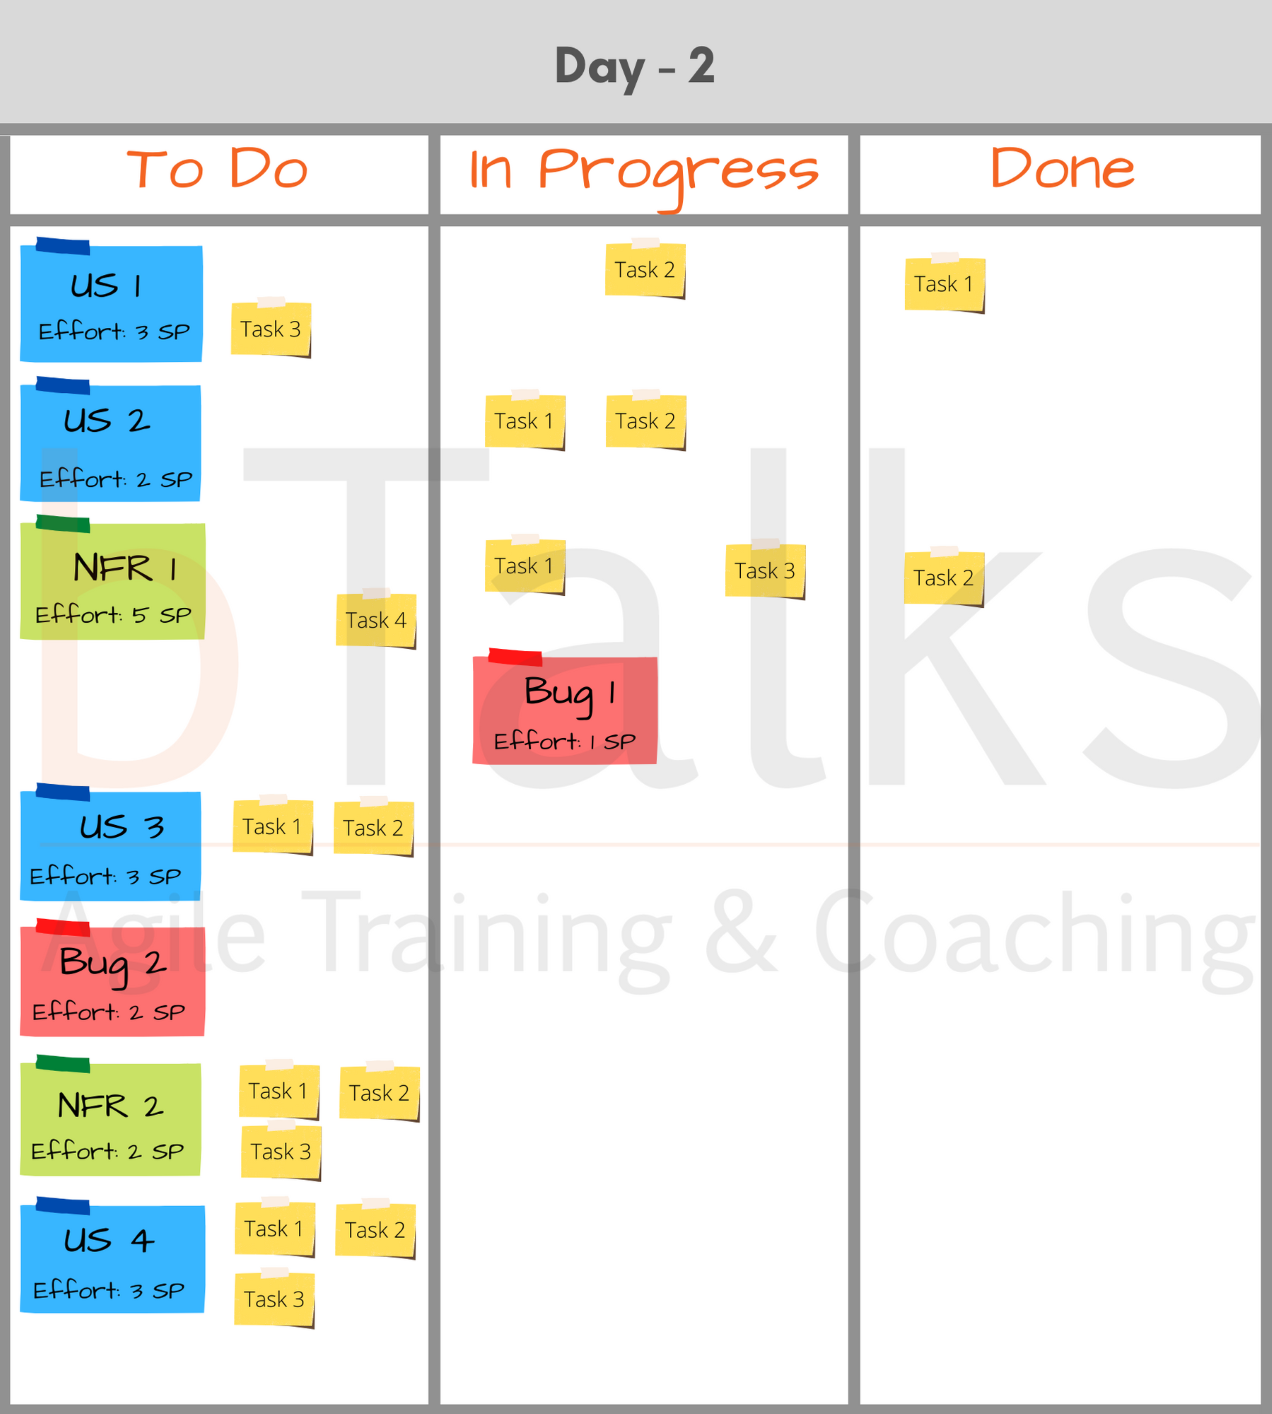
You may notice that there are two Tasks in Done column and you will ask why the team does not mark them on the Burndown Chart.
The team depicts only completed and tested functionalities on the Burndown Chart. The breakdown tasks are helpful to the team so that they can better organize themselves and check daily progress. Single tasks do not bring any value and That's way we do not take them into account on the Sprint Burndown Chart.
The third day follows. We see that the team has got done User Story 2, which is estimated to 2 Story Points. The Burndown Chart at the end of the Daily Standup meeting on the third day looks like this.
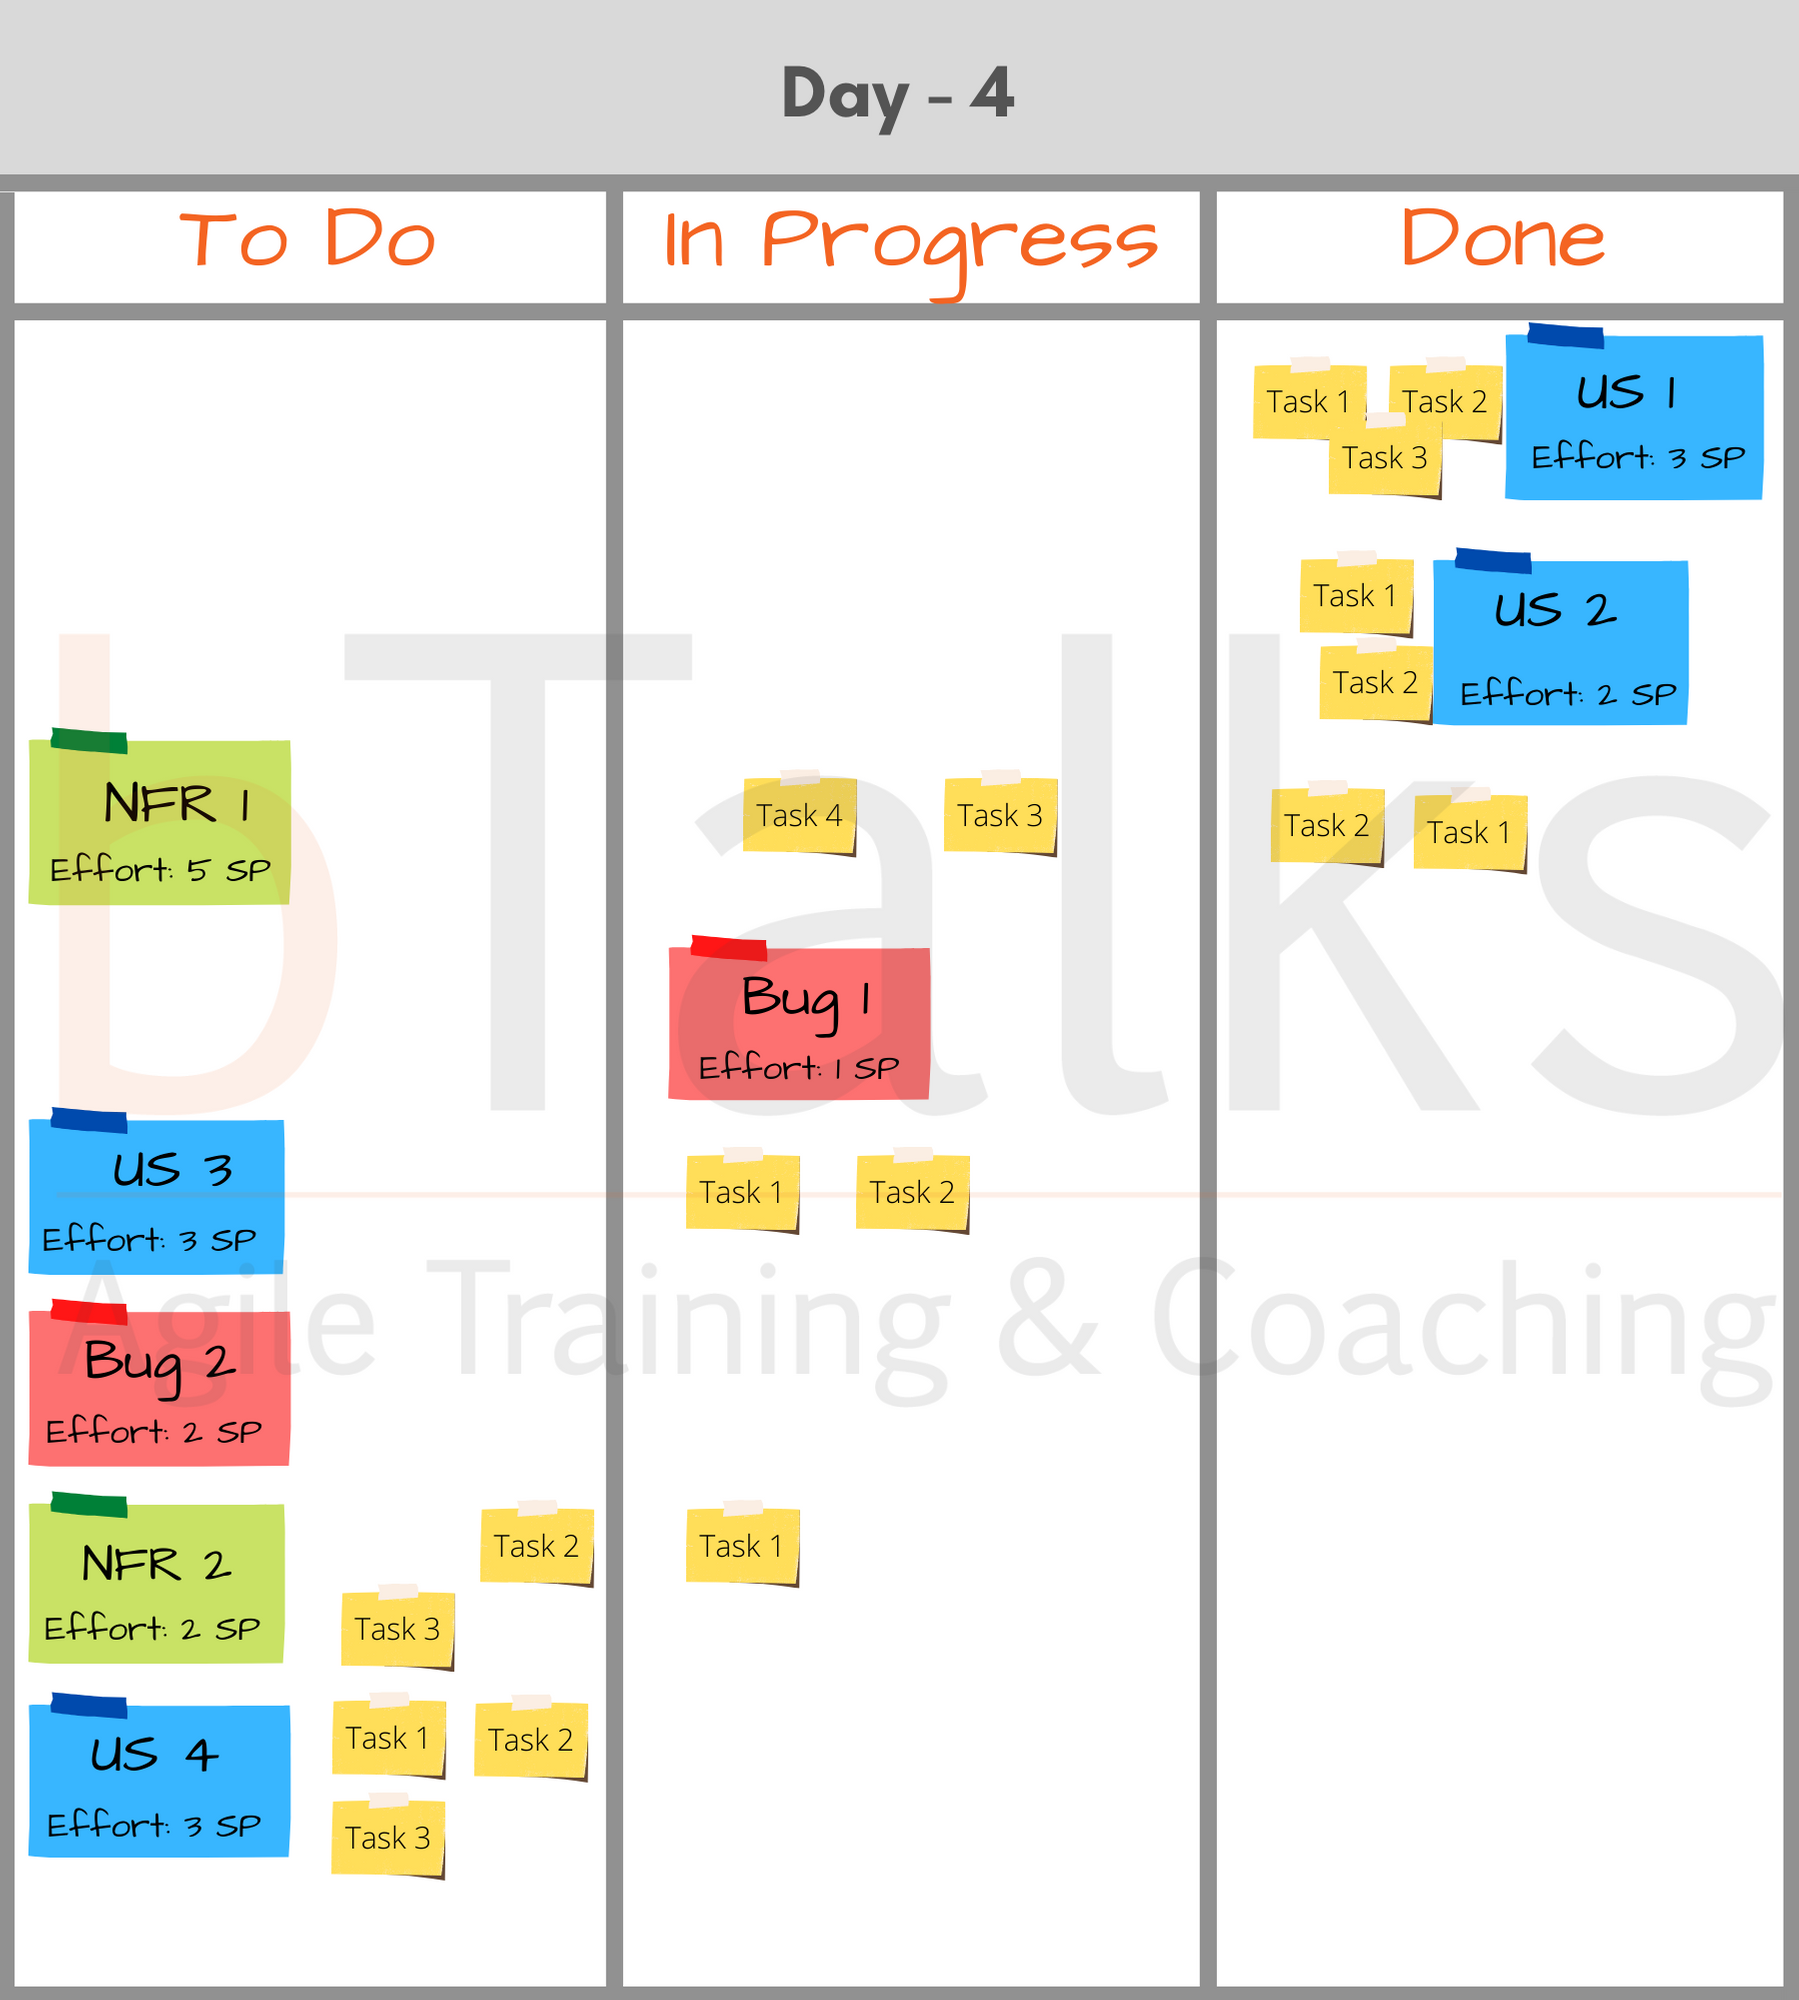
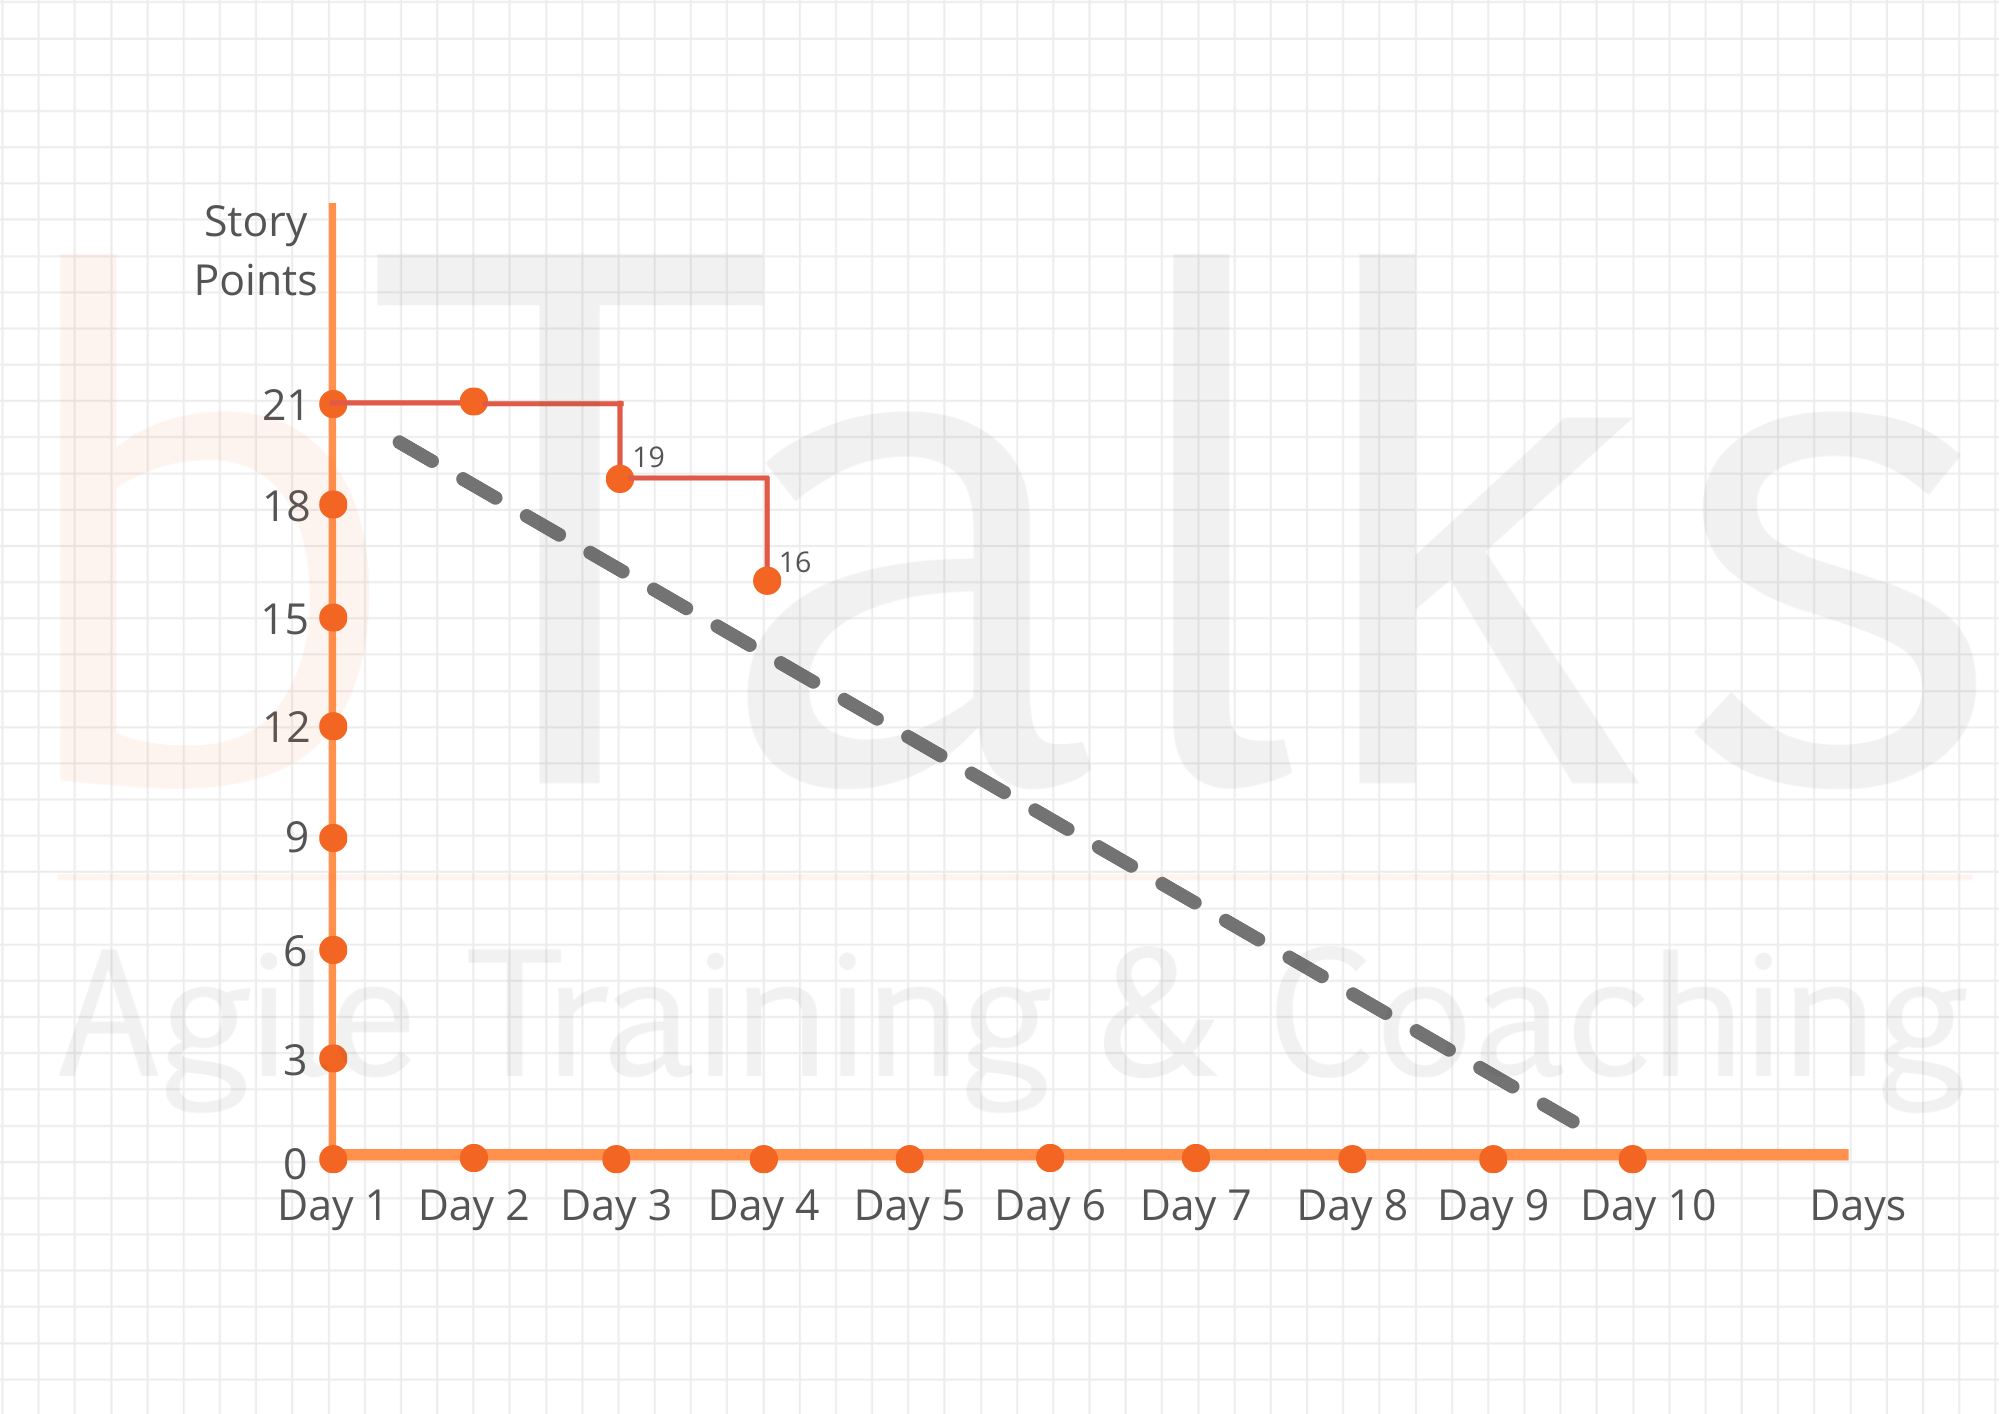
On the fourth day, the team managed to complete work for 3 more Story Points (5 in total). When the team applies the current status to the Burndown Chart, it always calculates the total amount of work in the Done column. Their Burndown Chart on the fourth day will look like this.

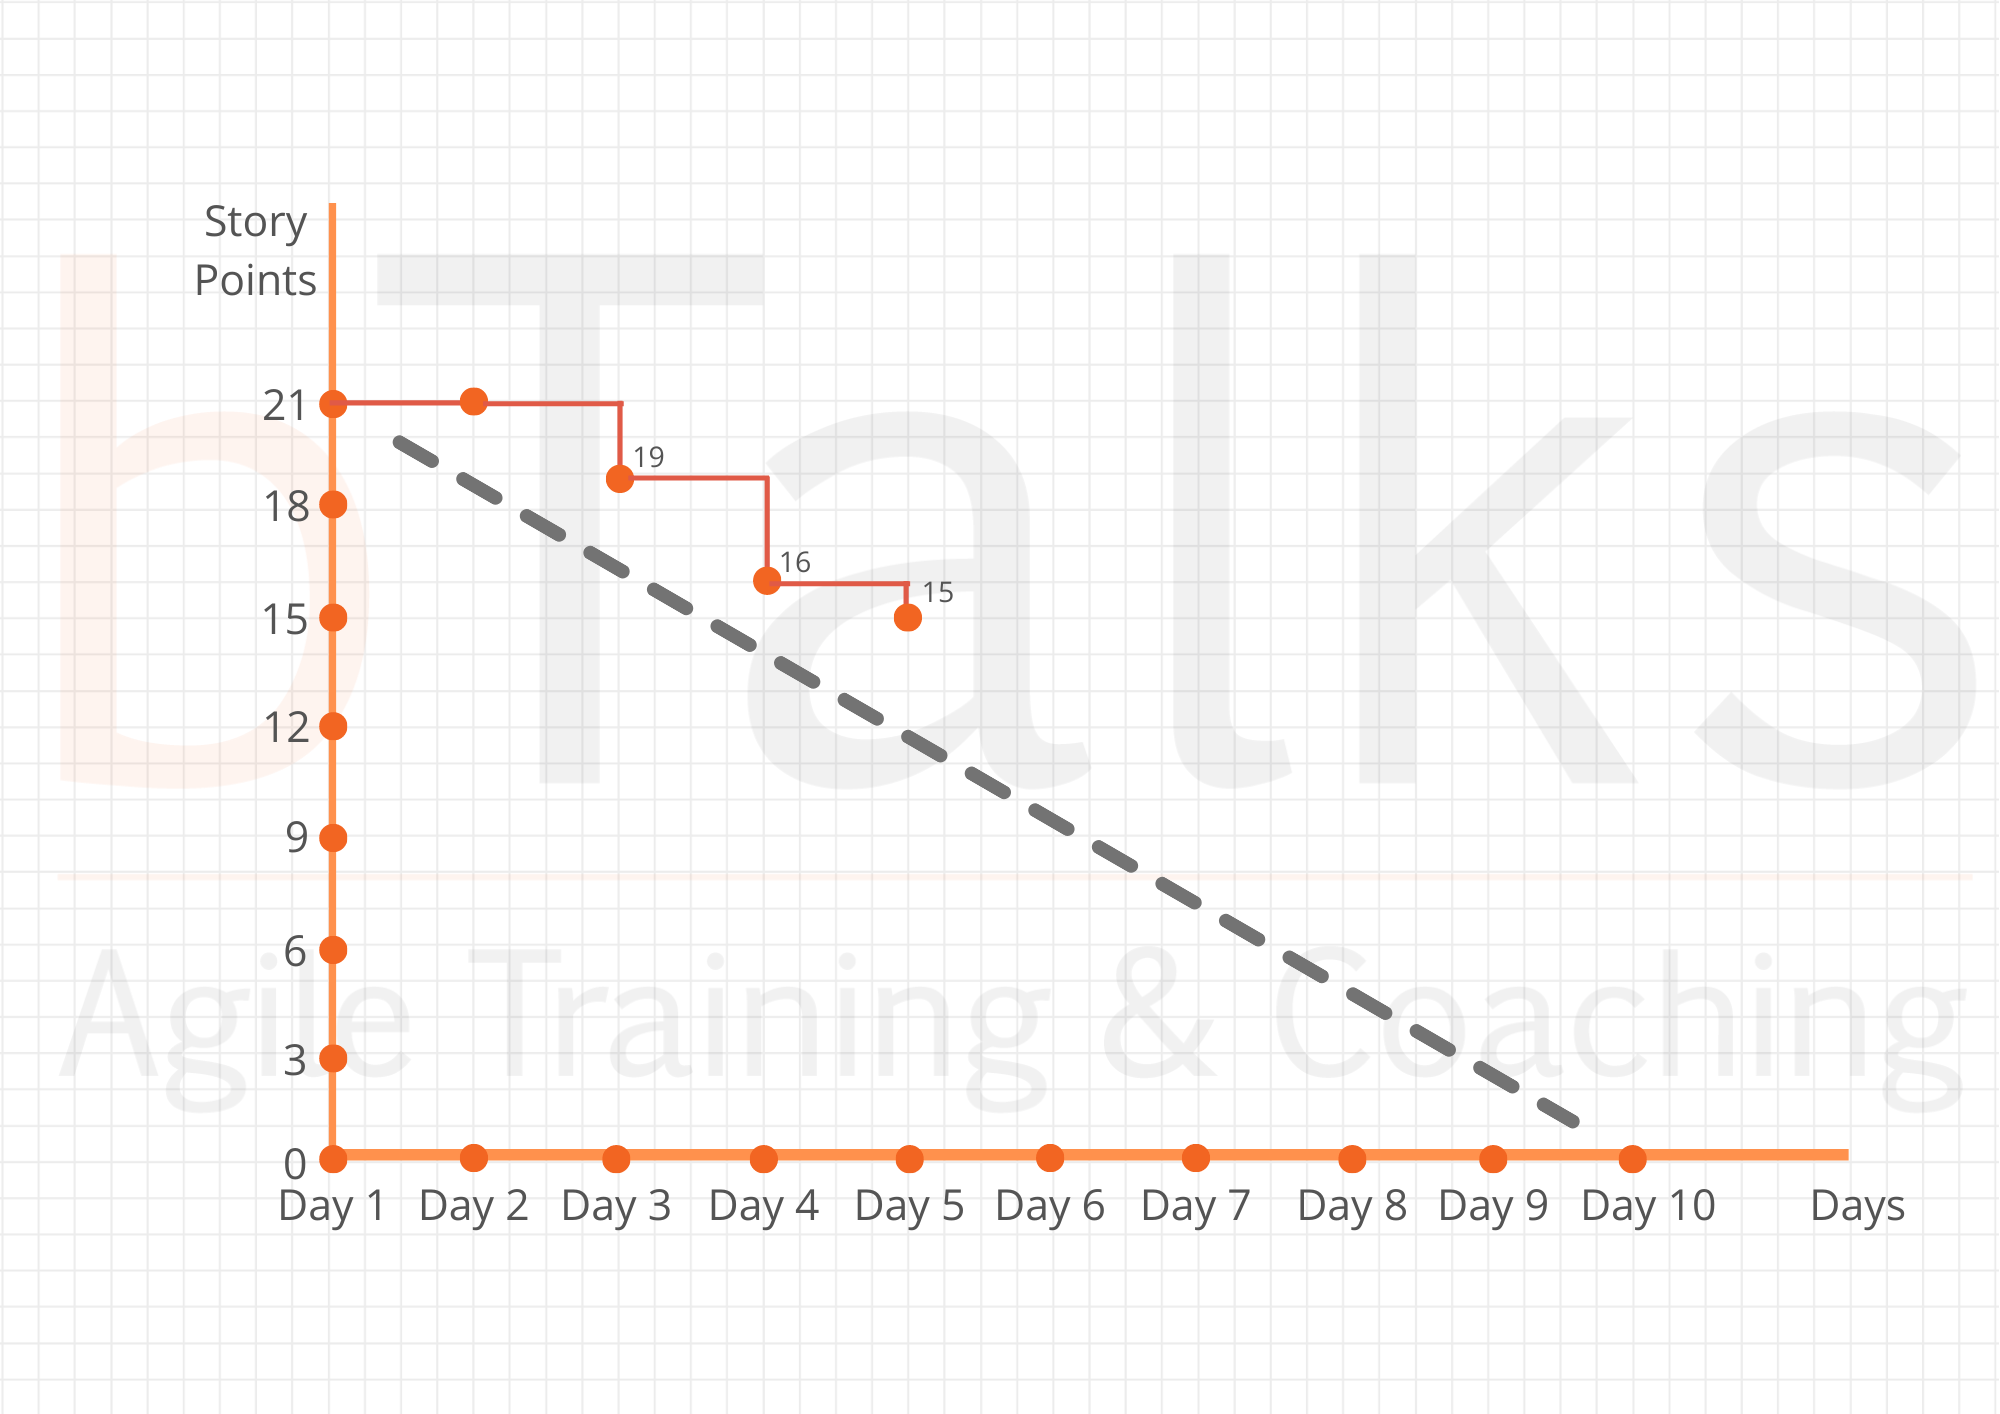
Day 5 - 1 more Story Point, (6 in total).
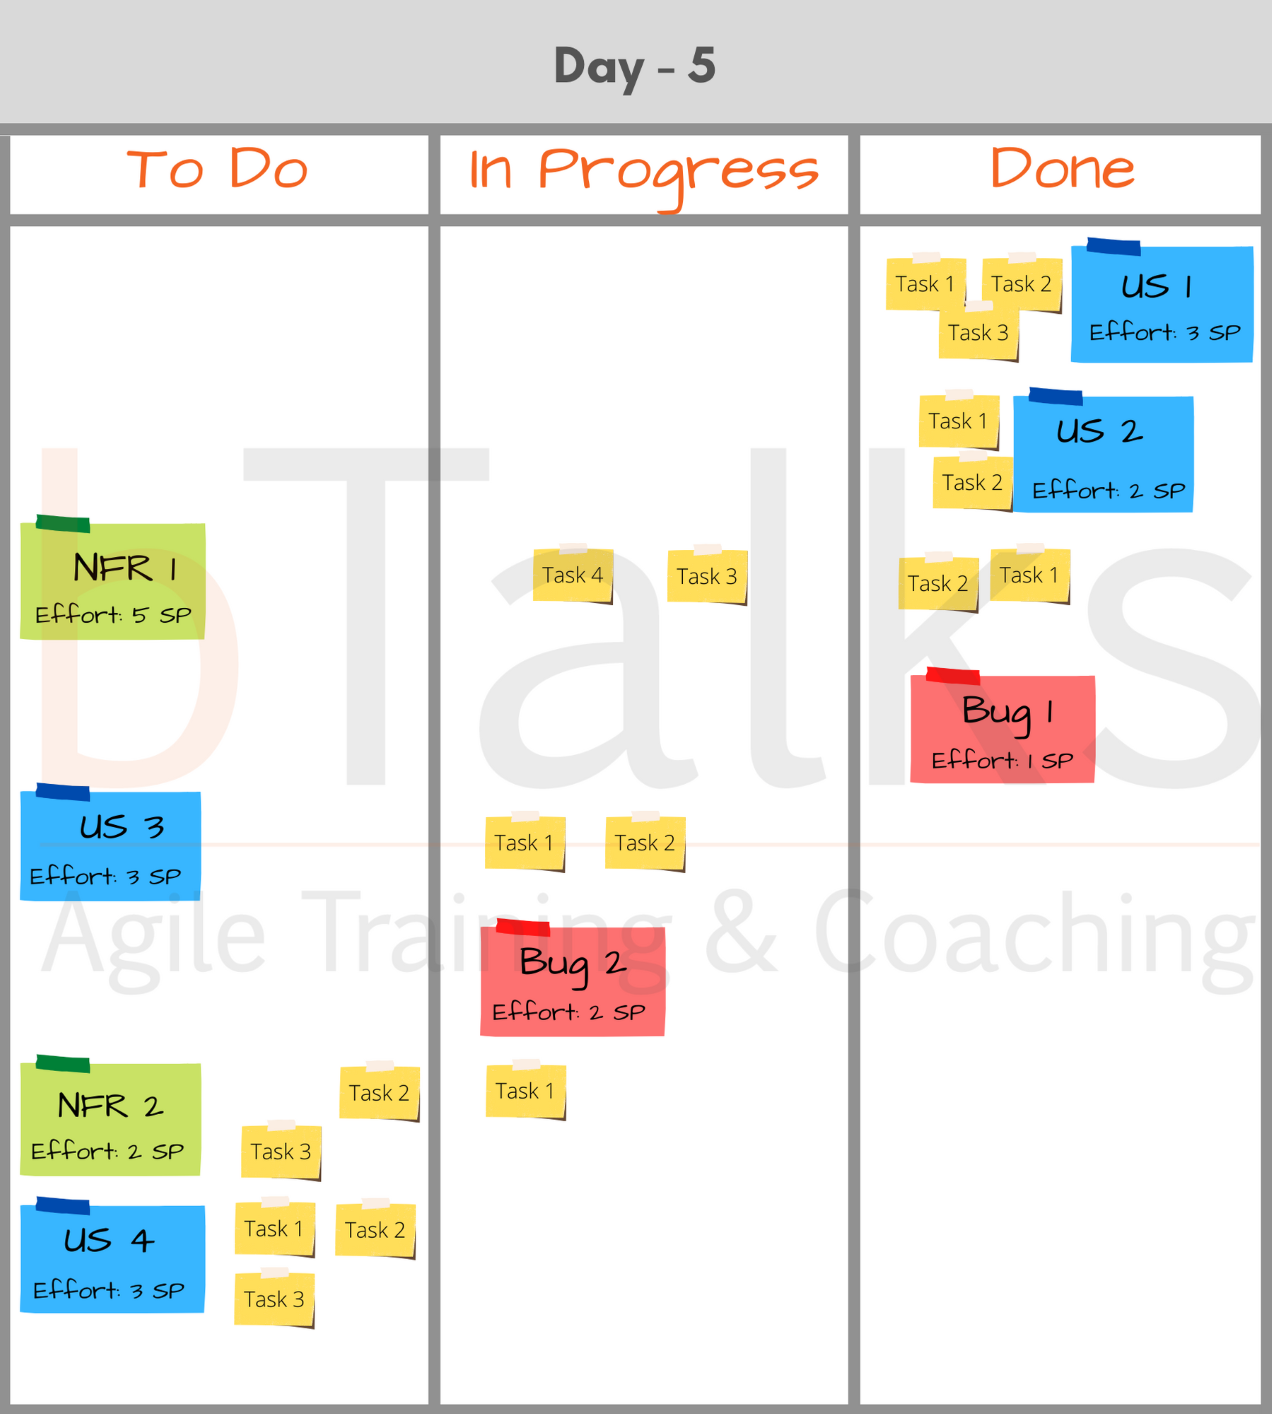
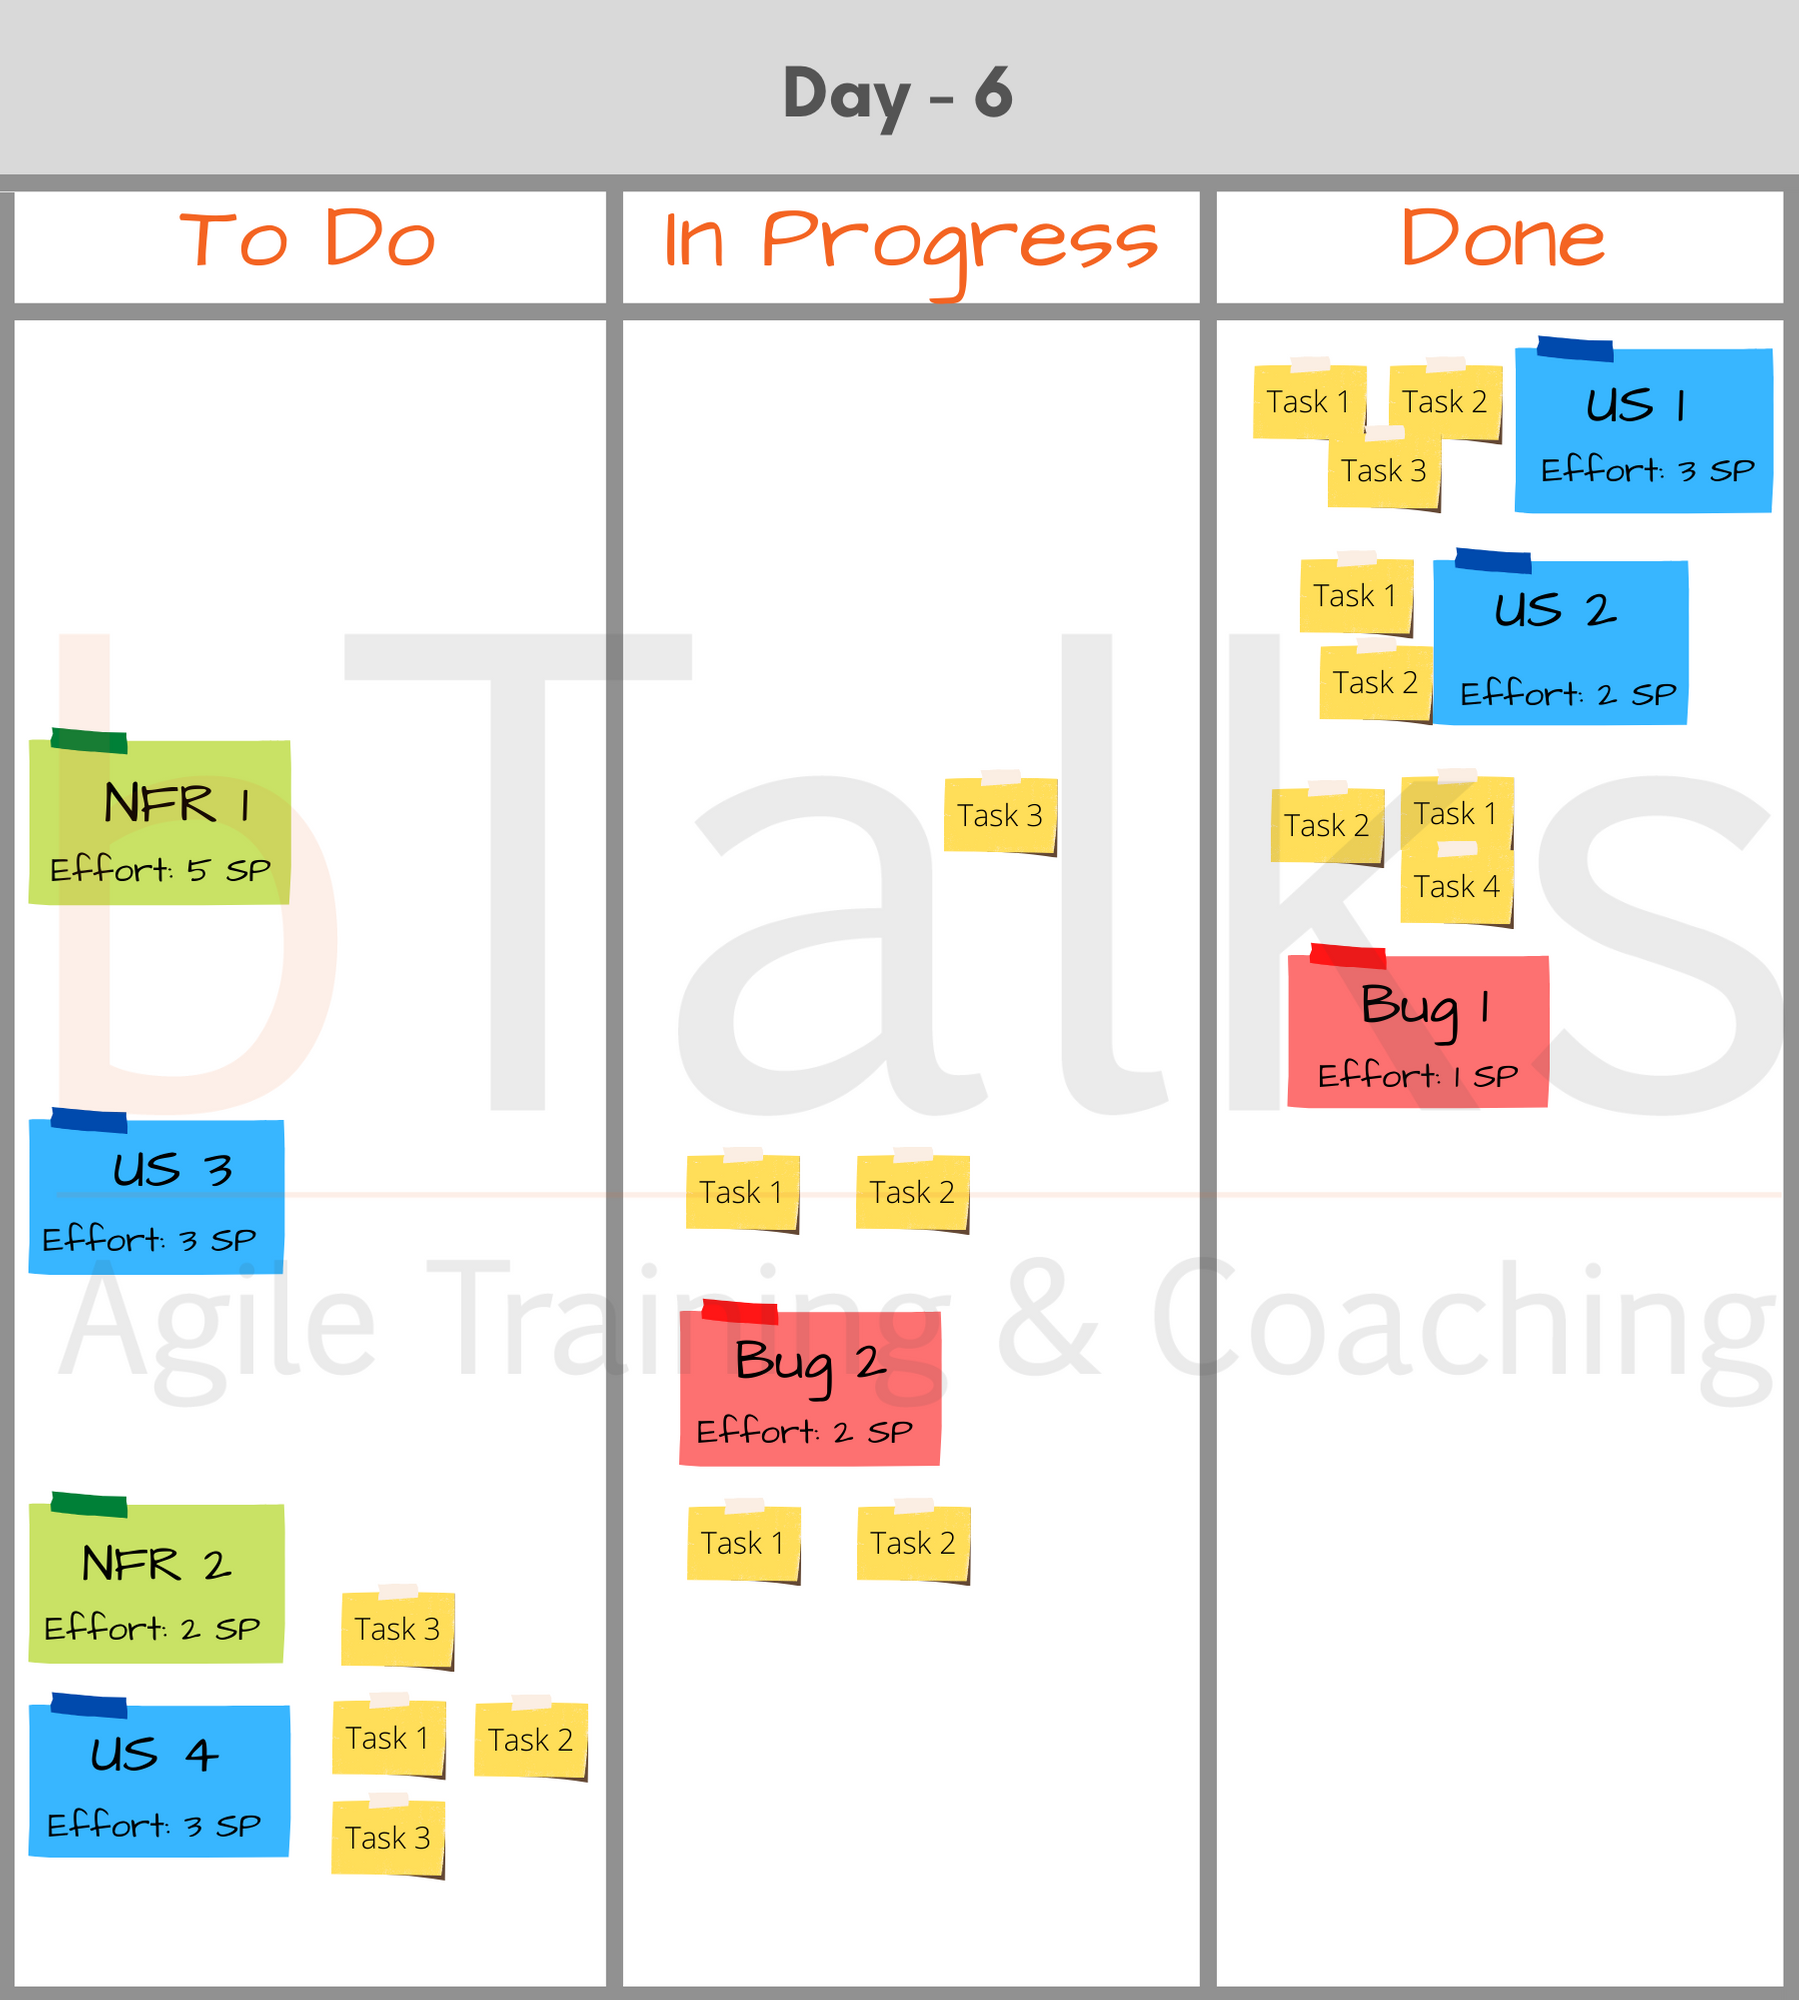
Day 6 - the team did not mark anything as Done.

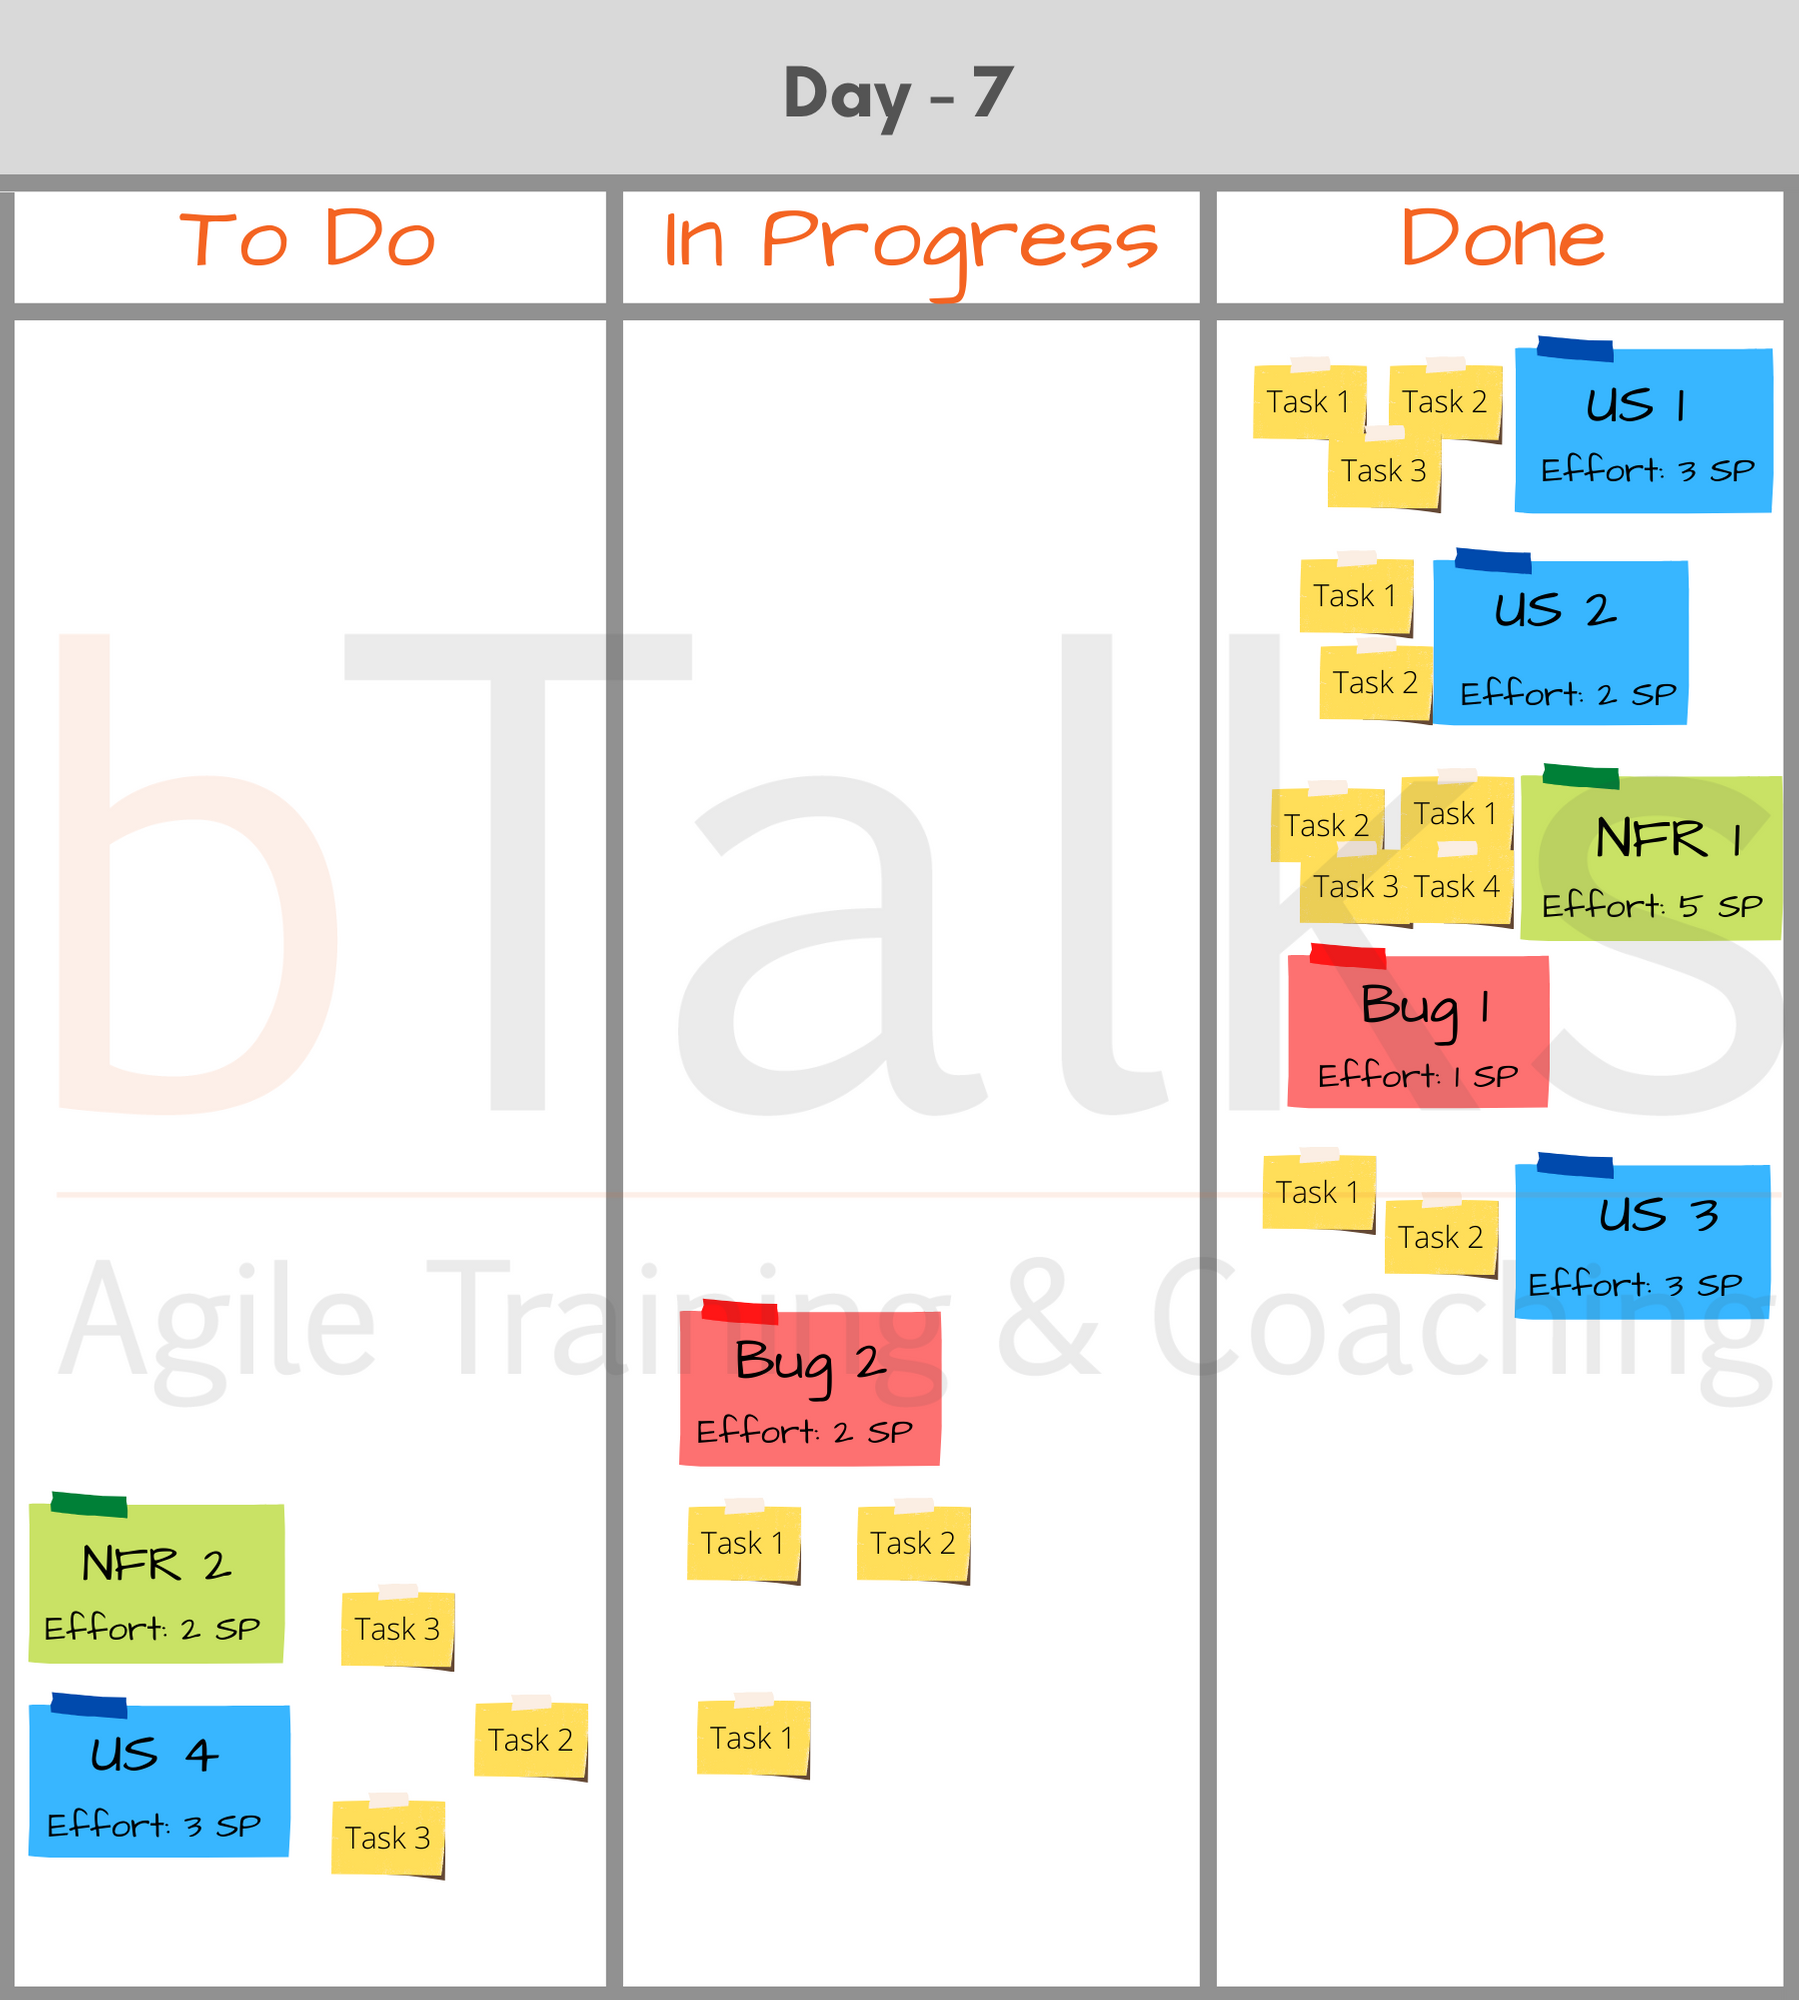
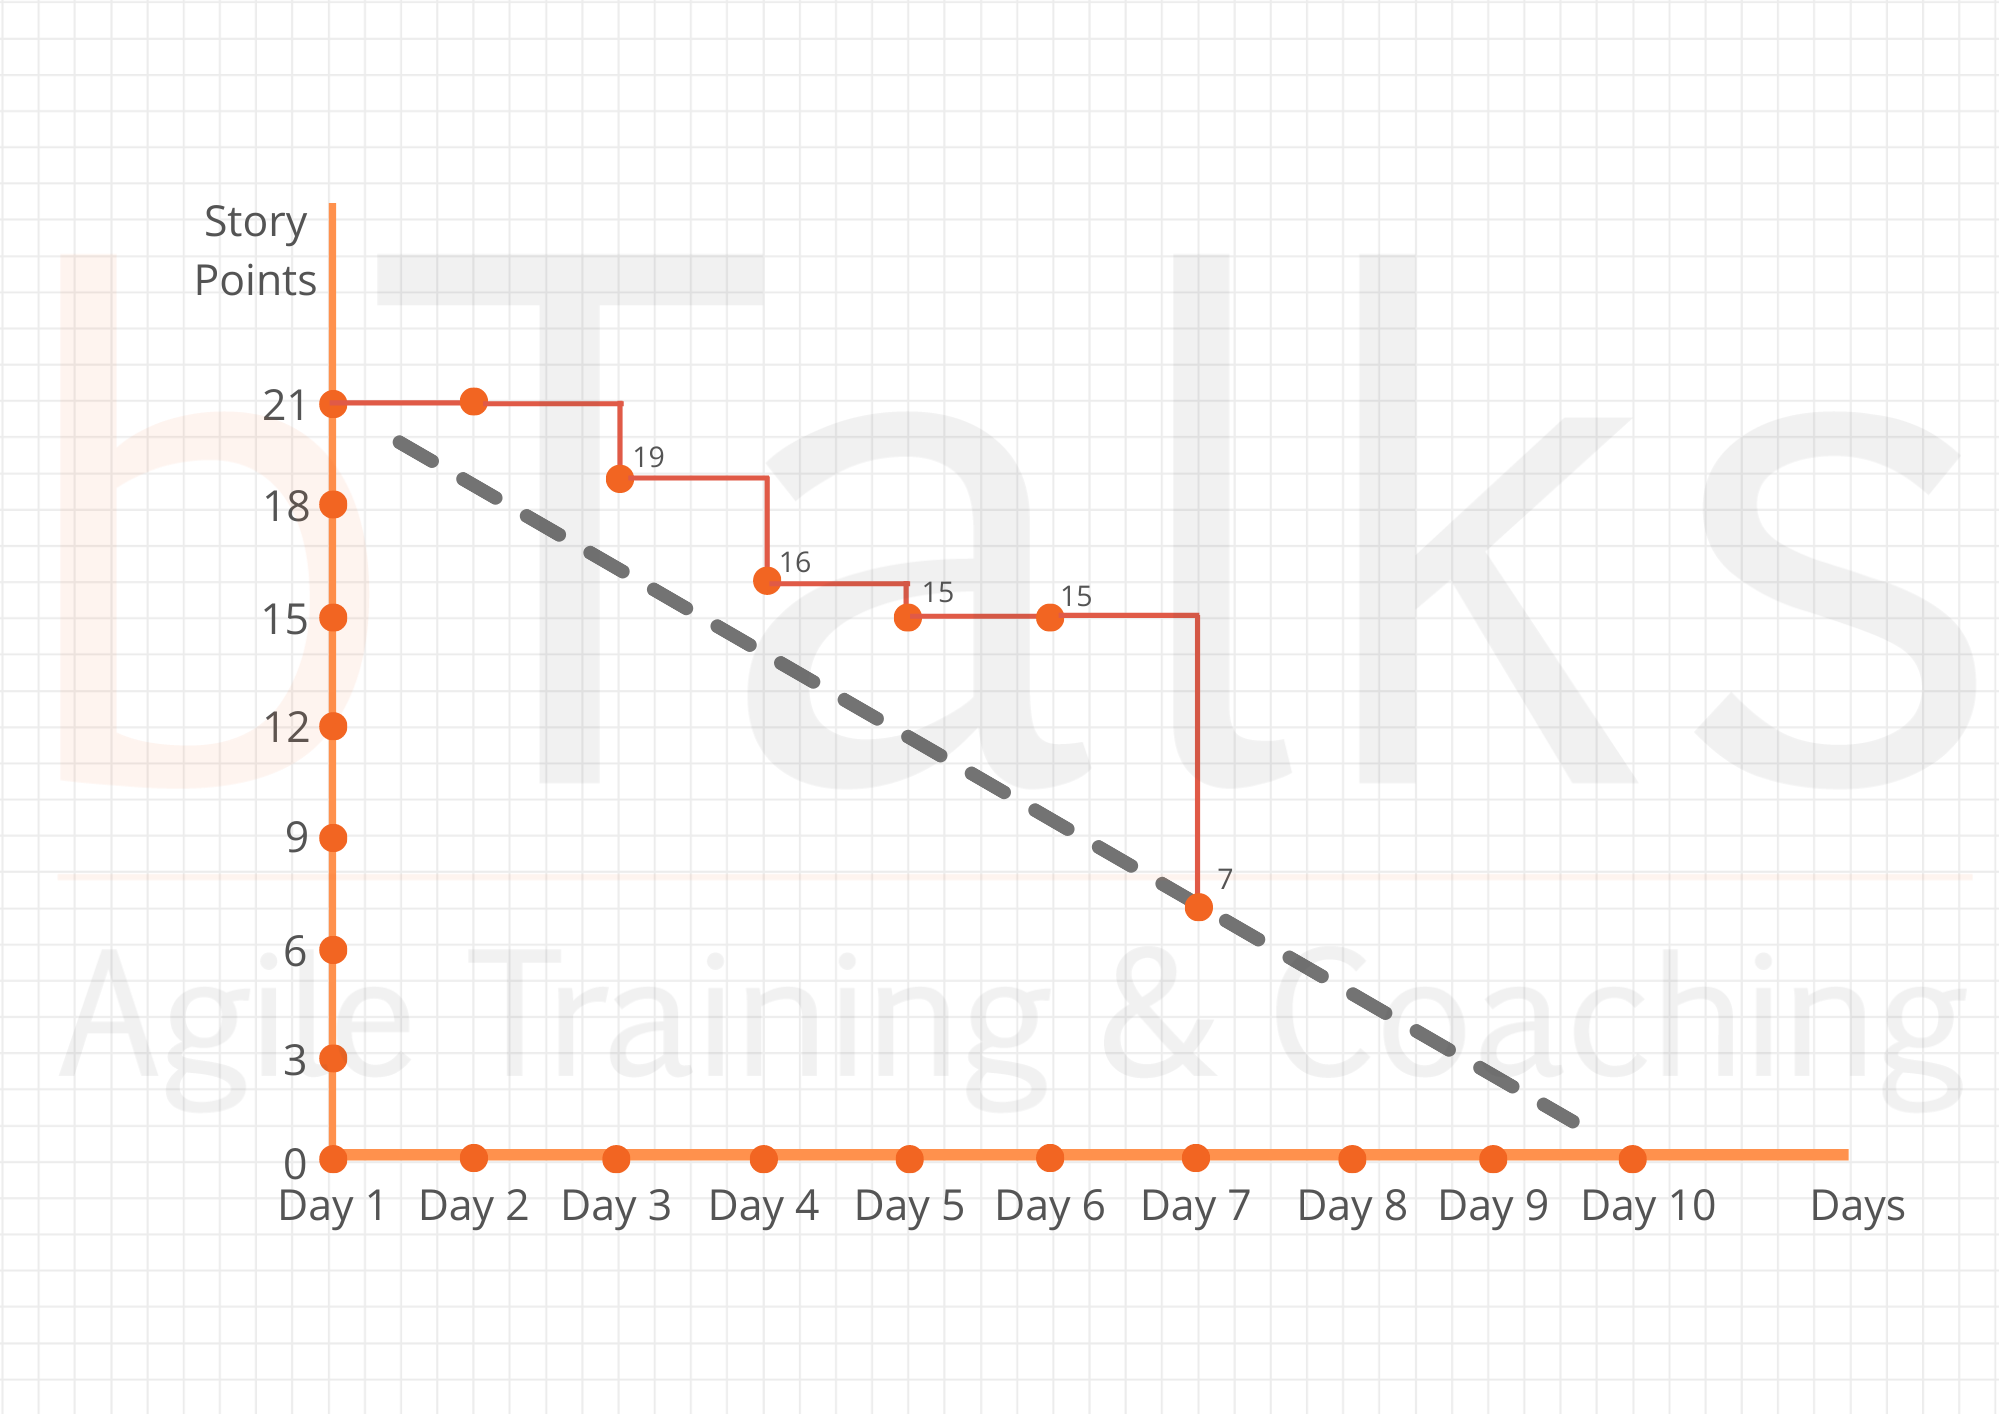
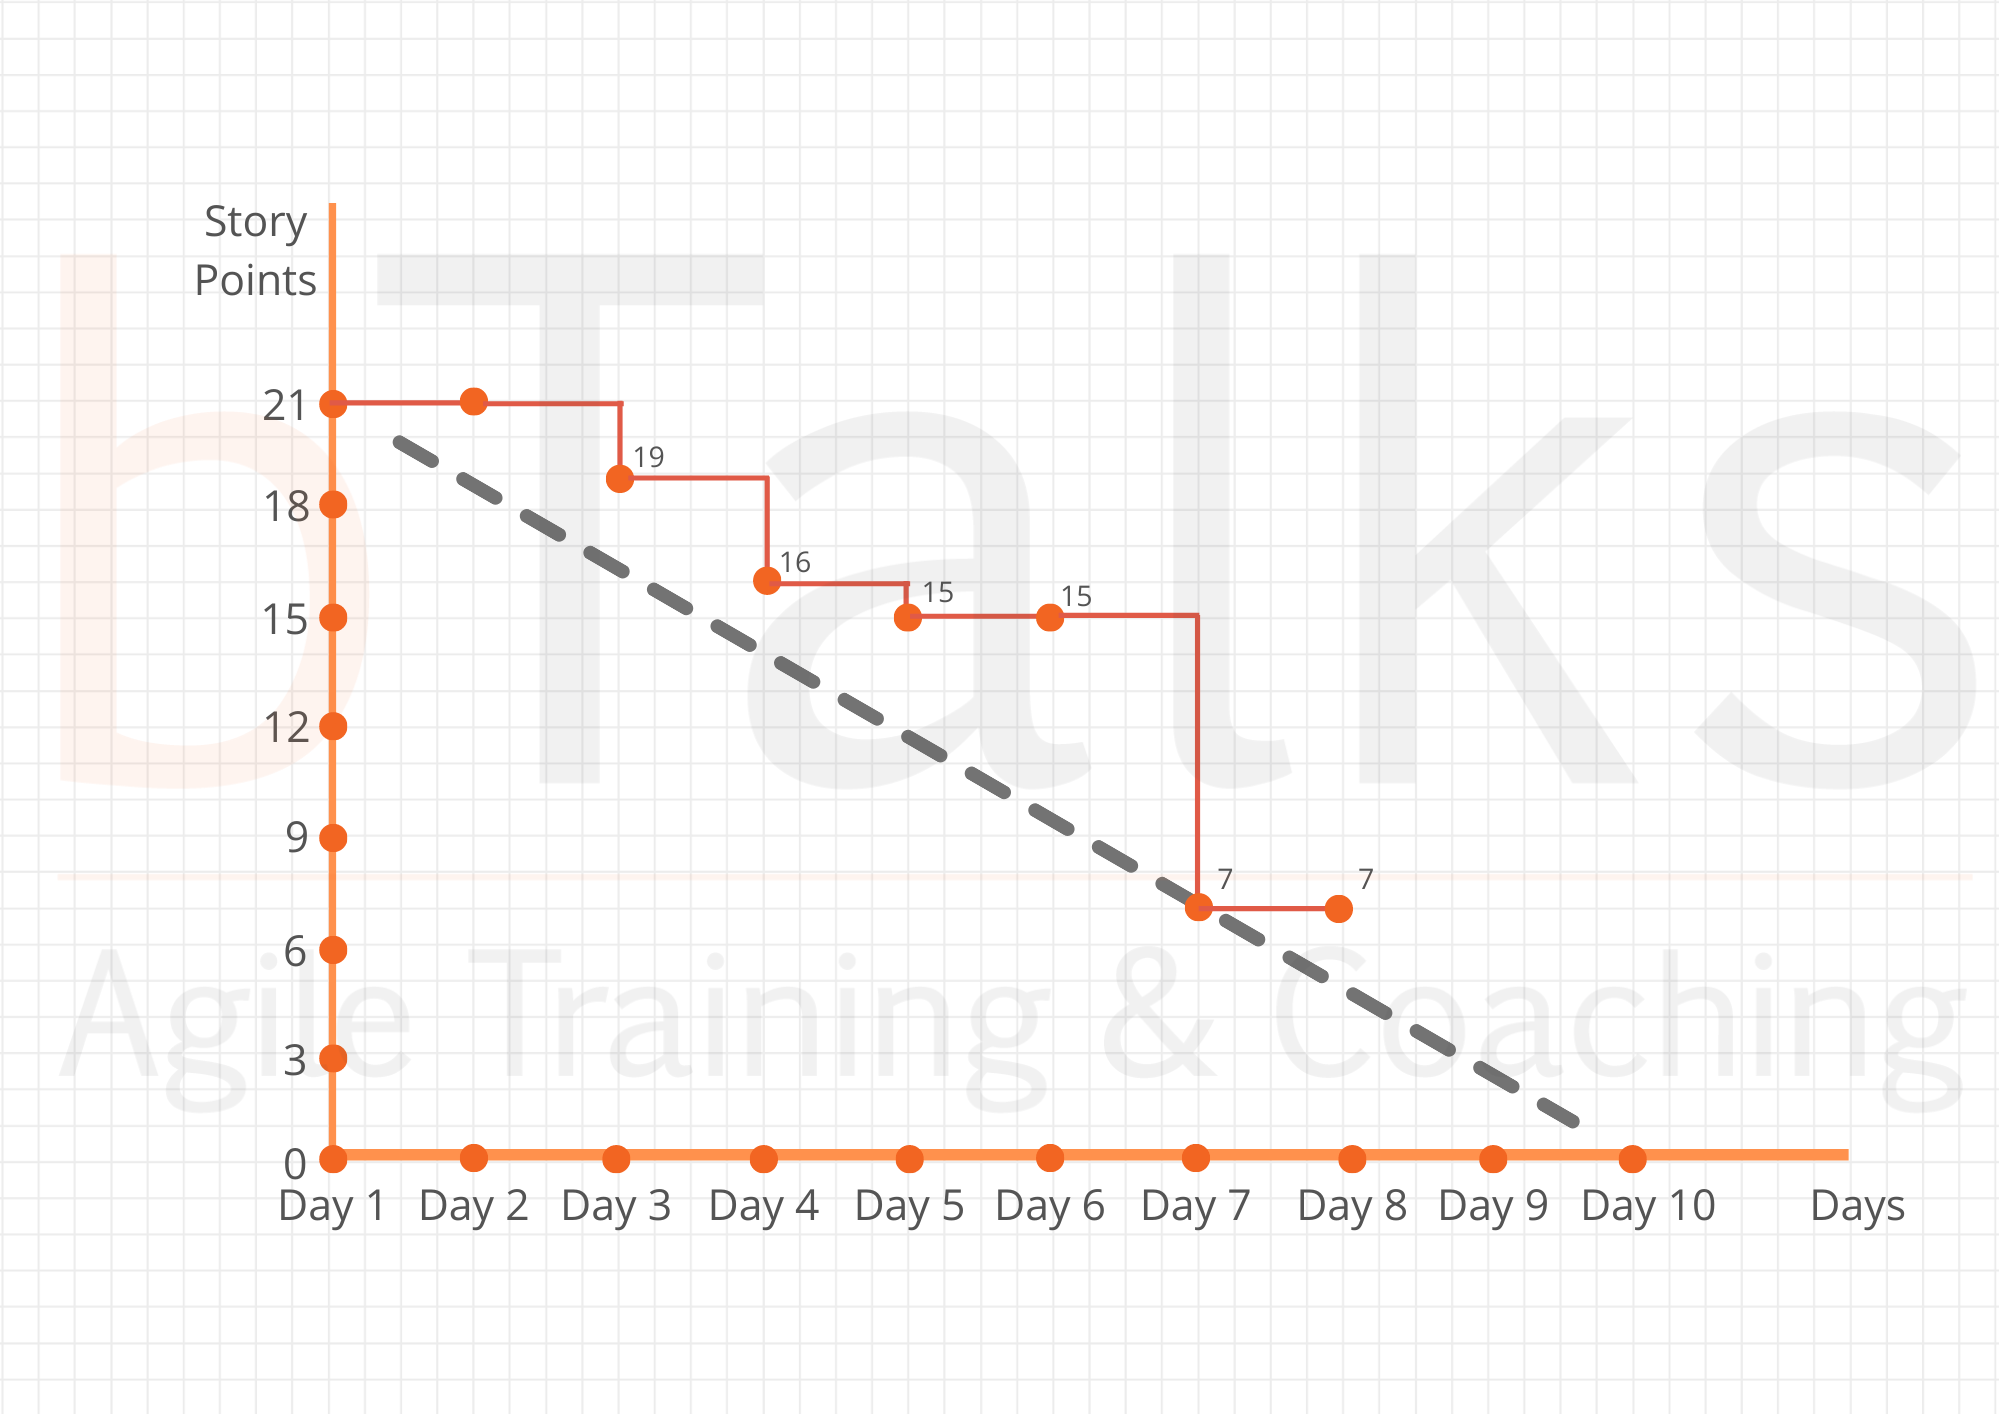
Day 7 - the total amount in the "Done" column is 14 Story Points, the previous day there were 6 Story Points. This means that the team has managed to complete work for 8 Story Points in the last 24 hours.
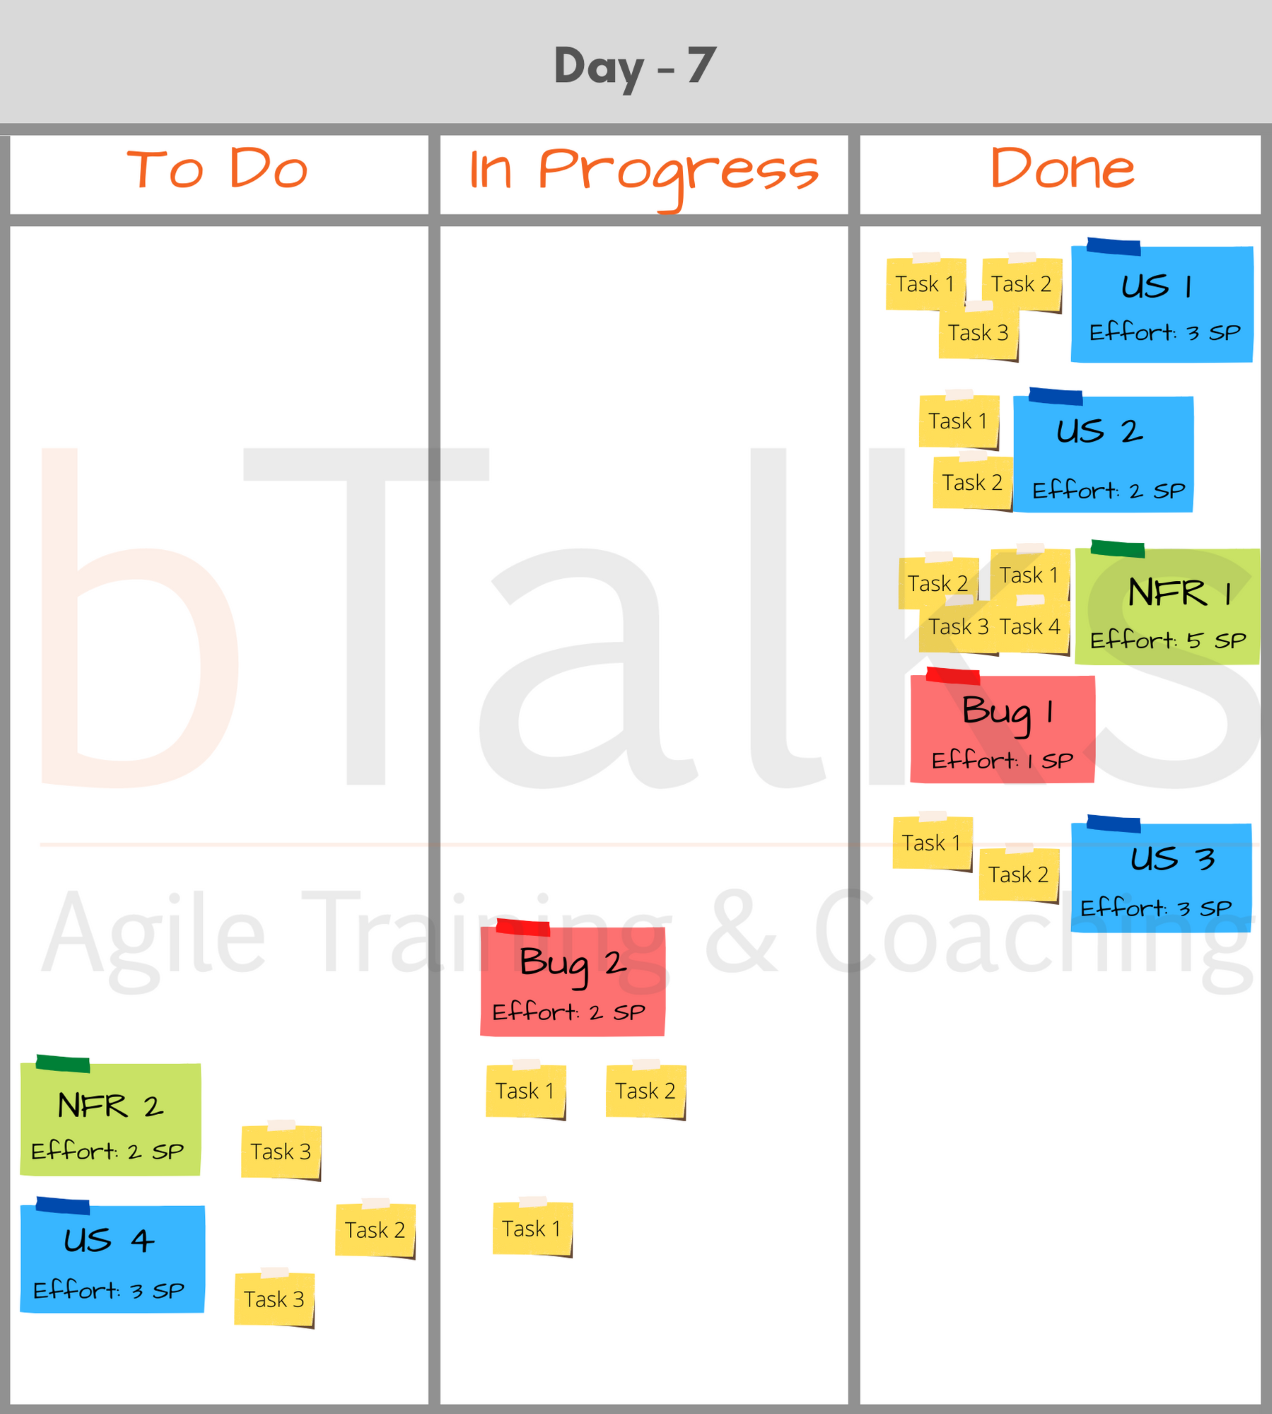
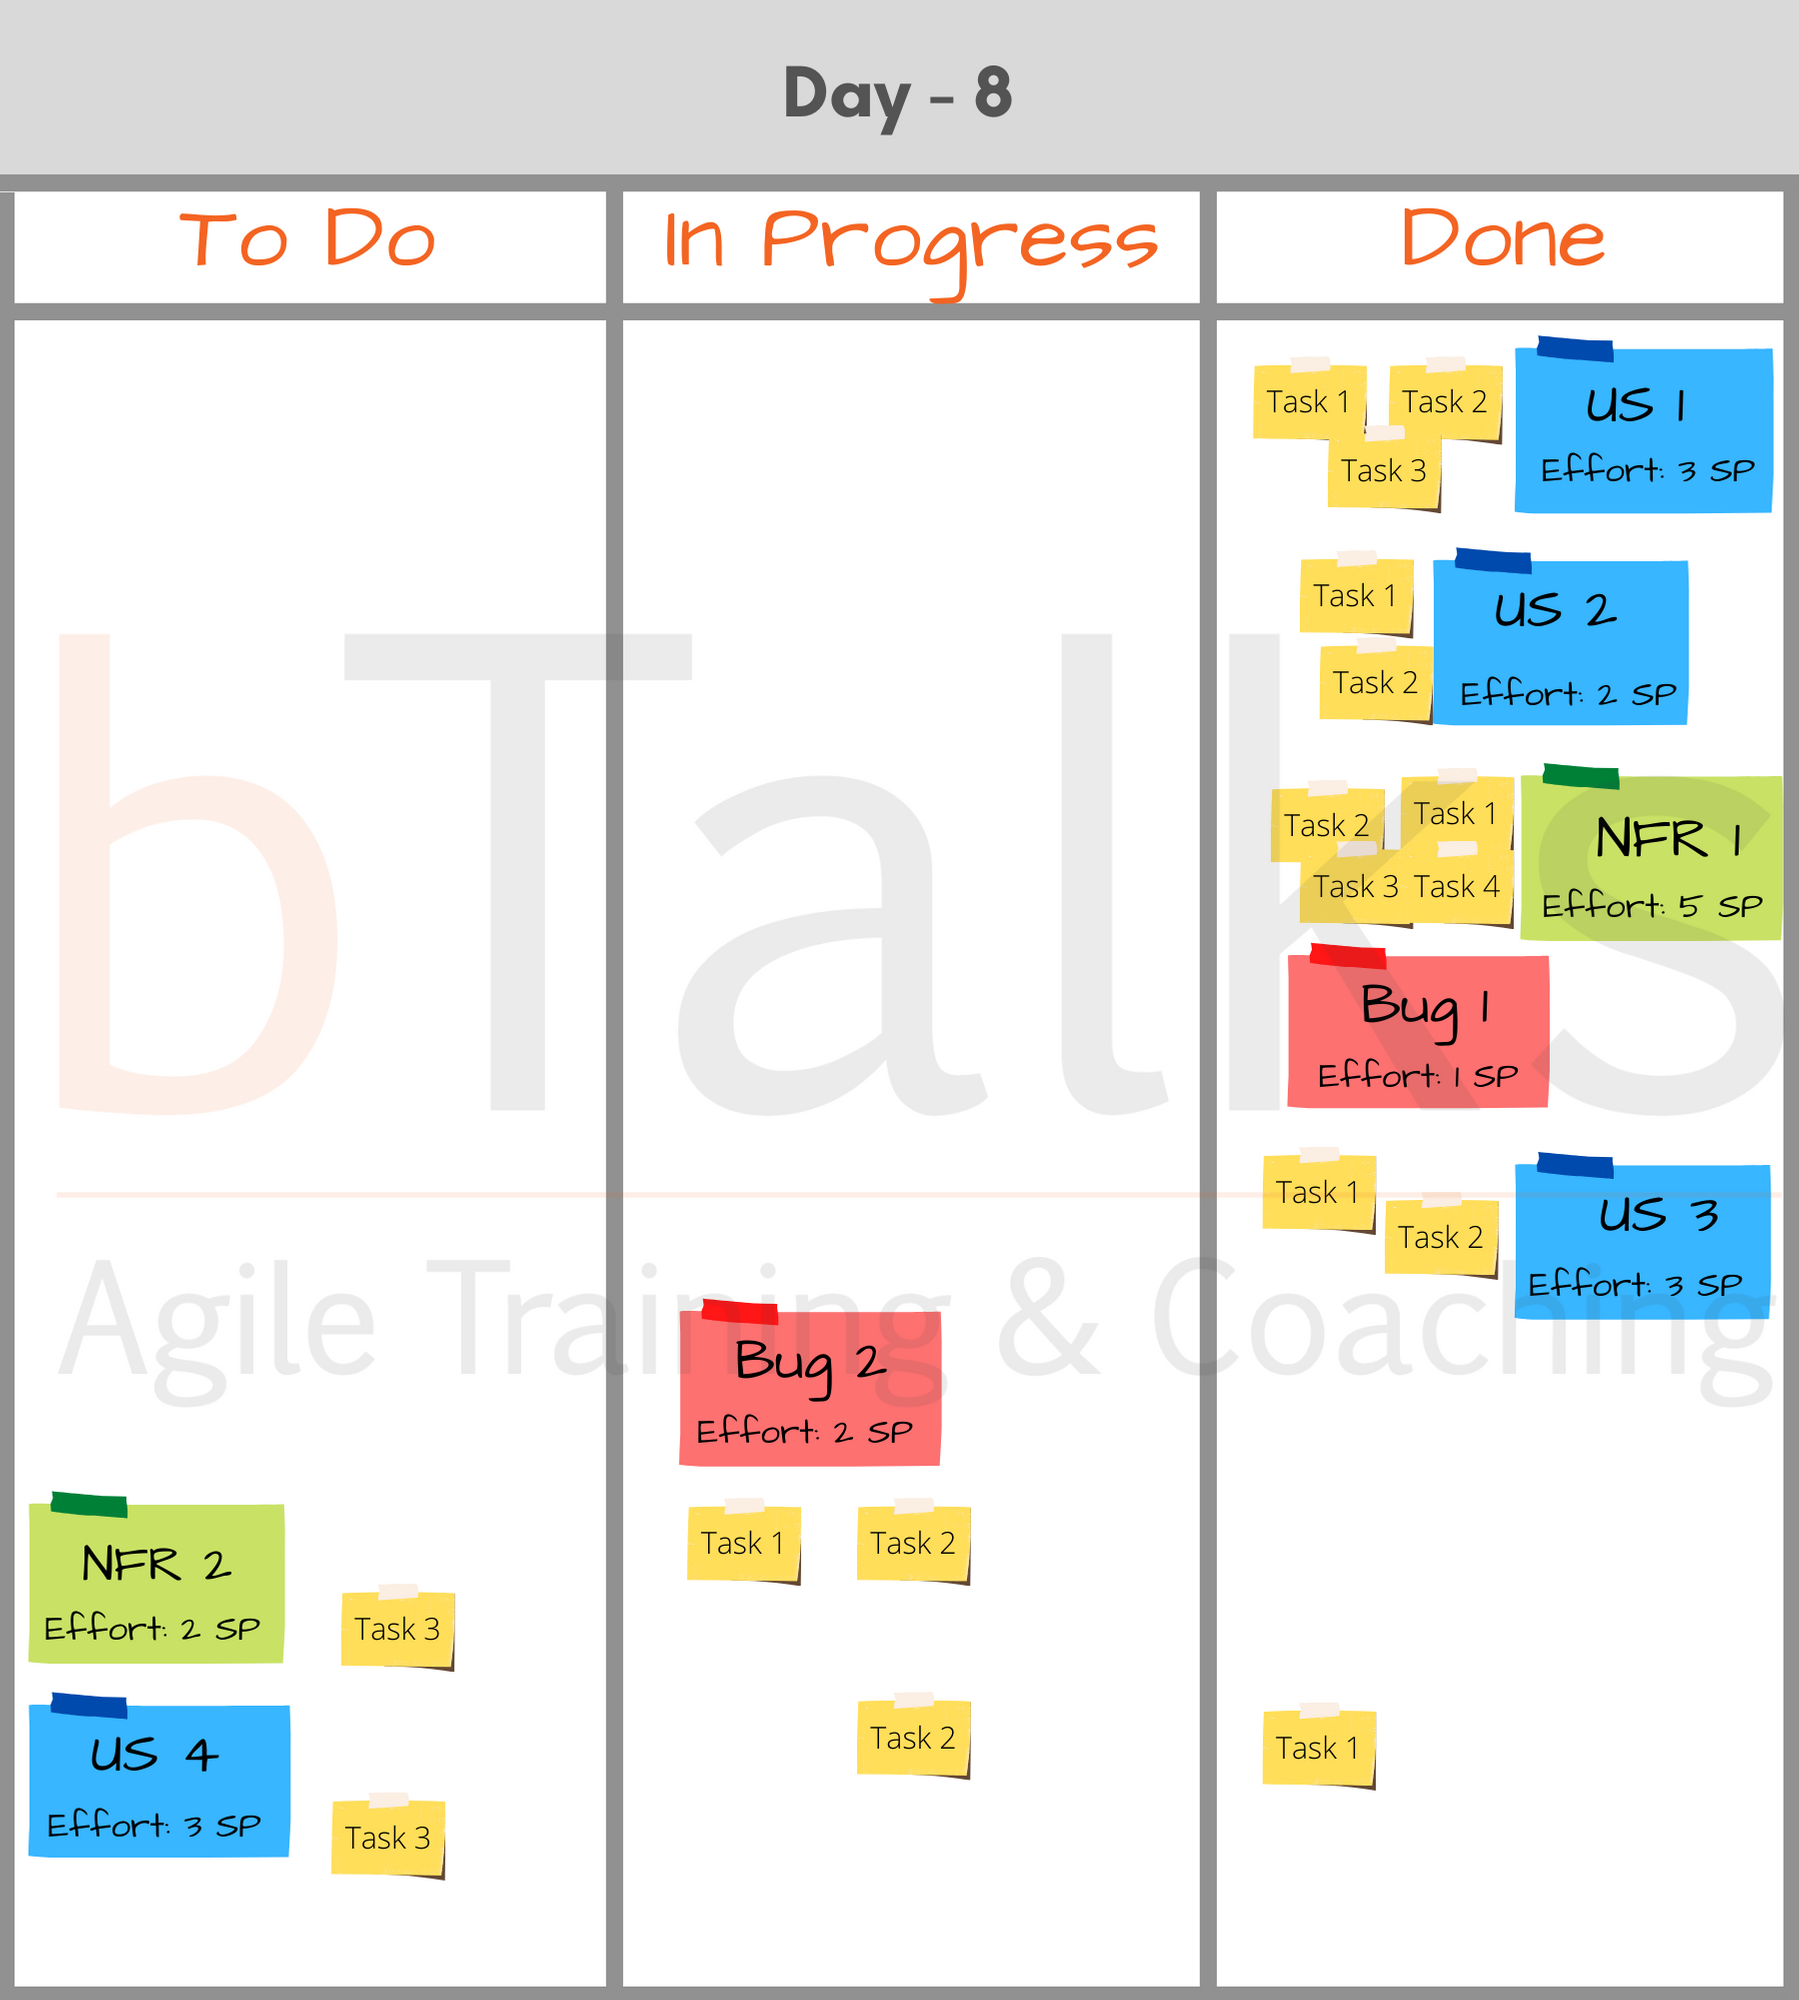
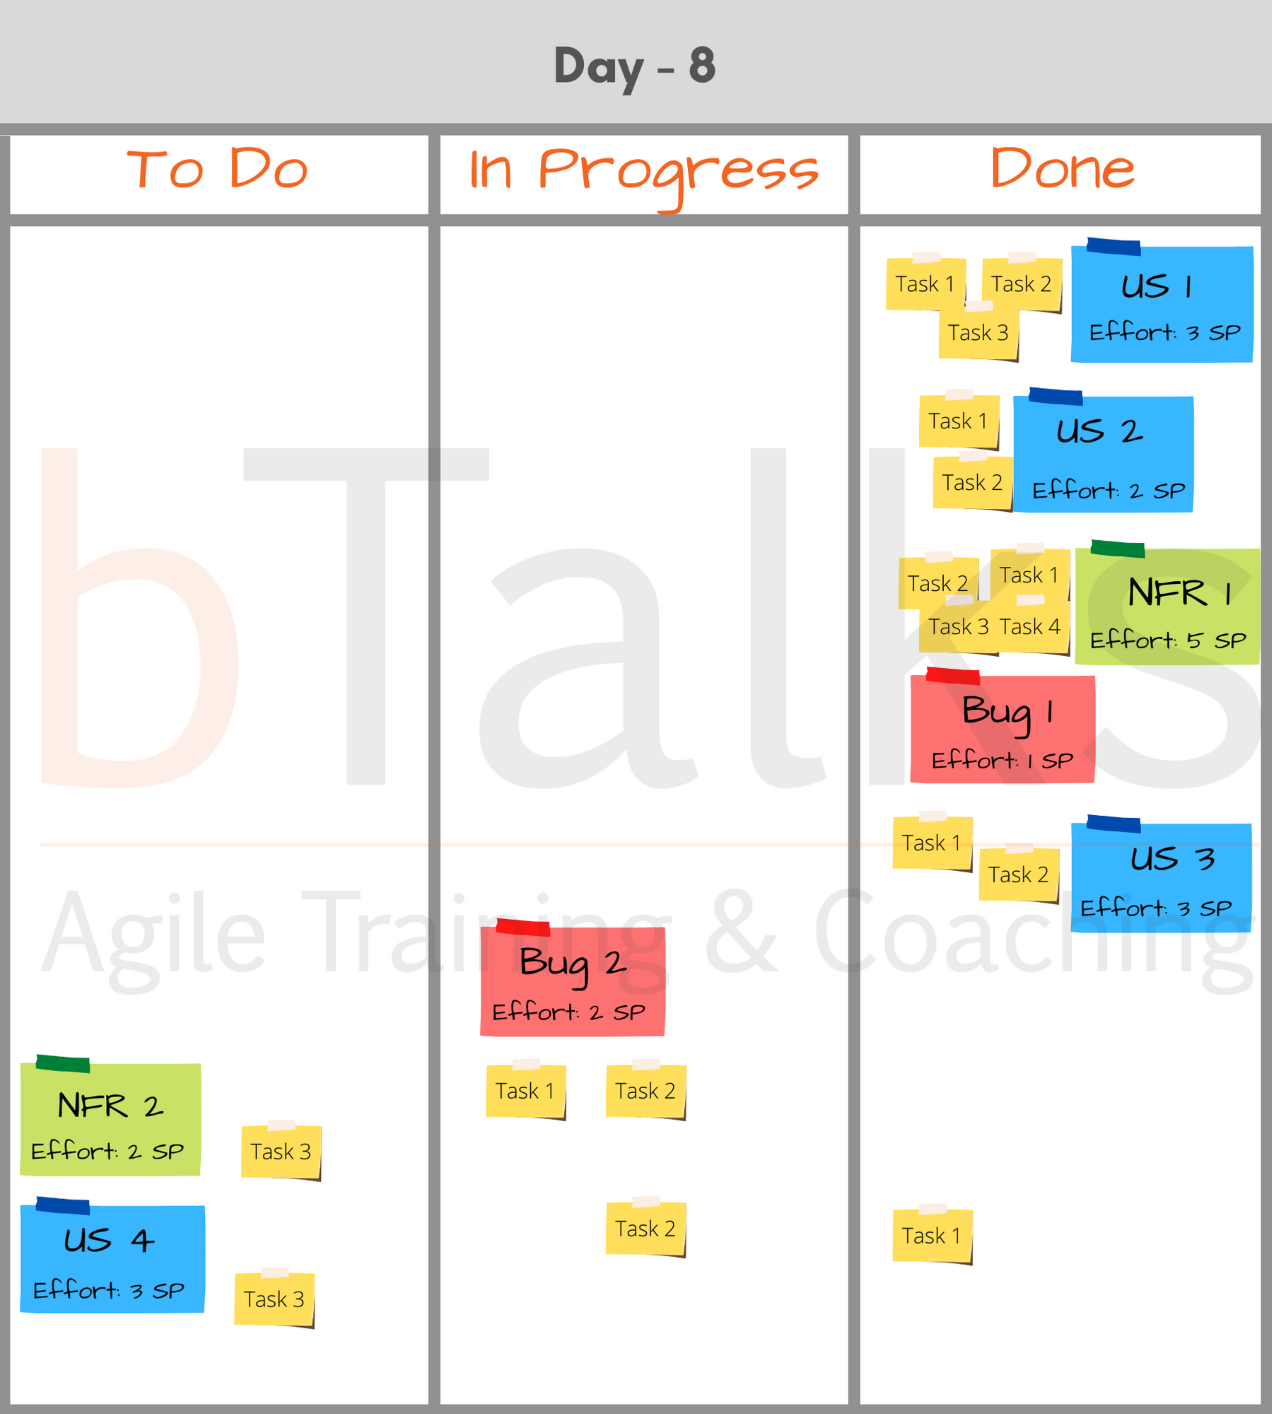
Day 8
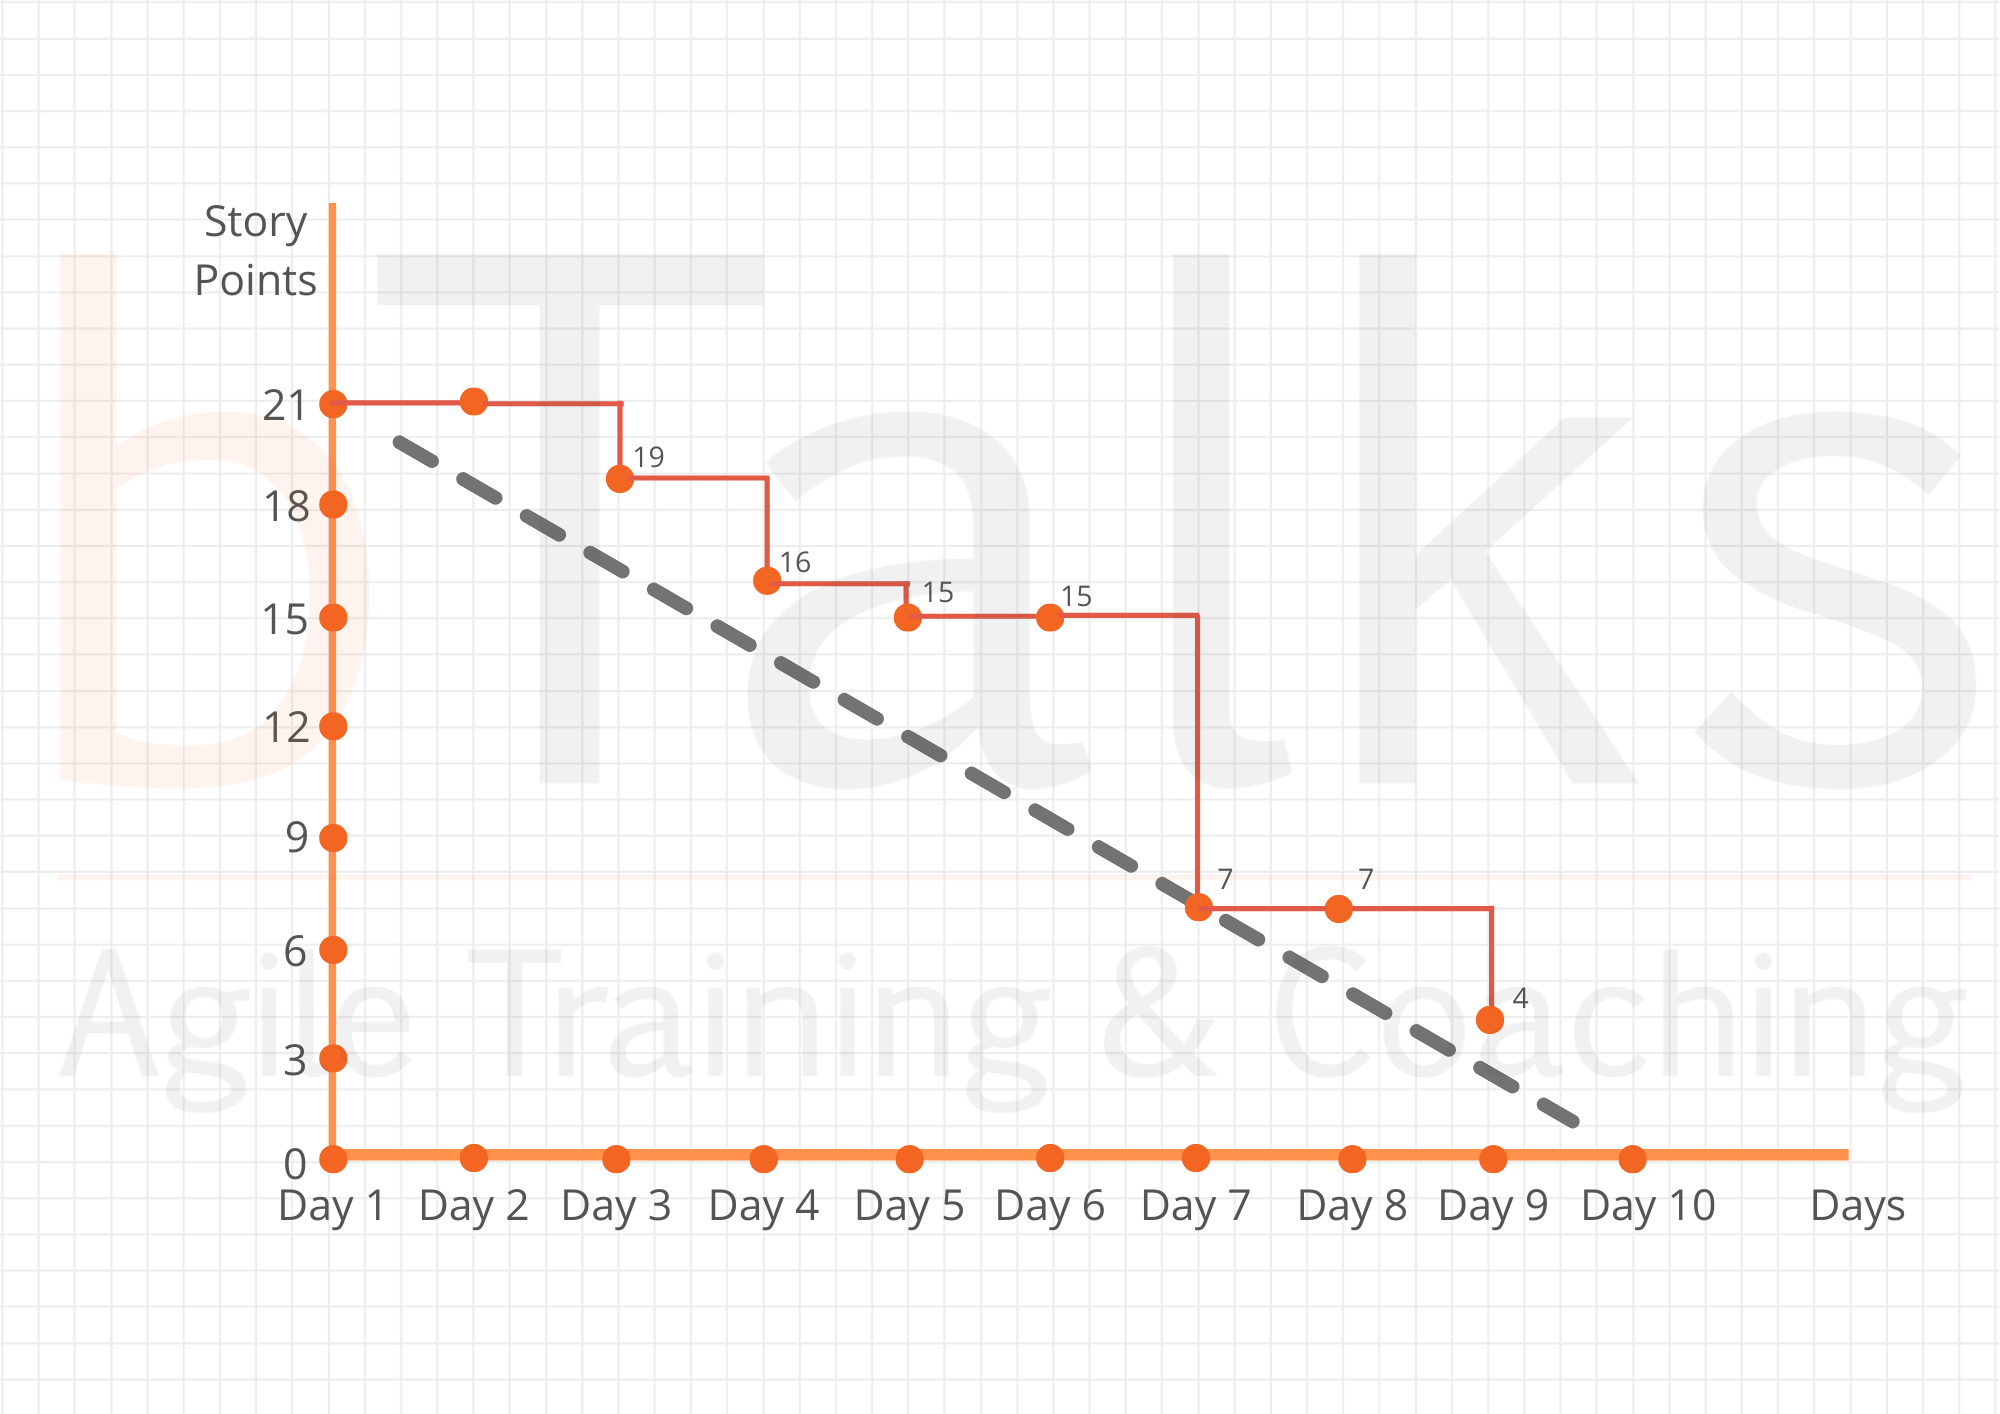
Day 9
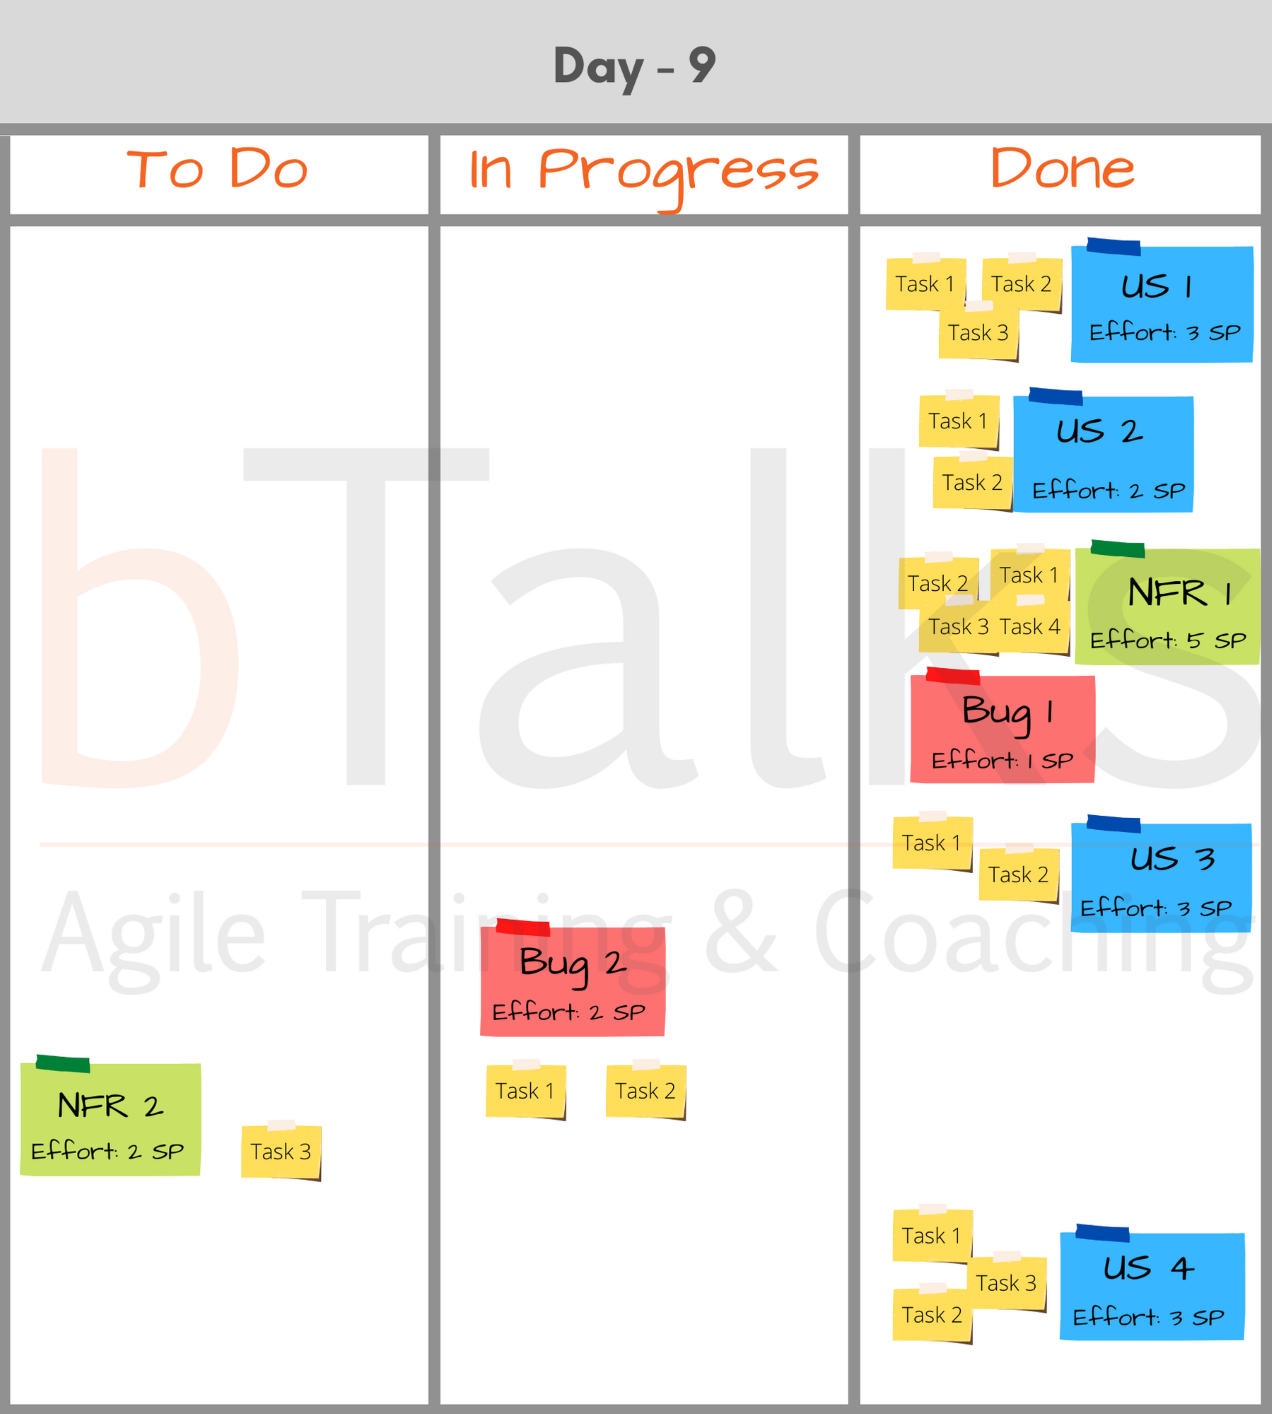
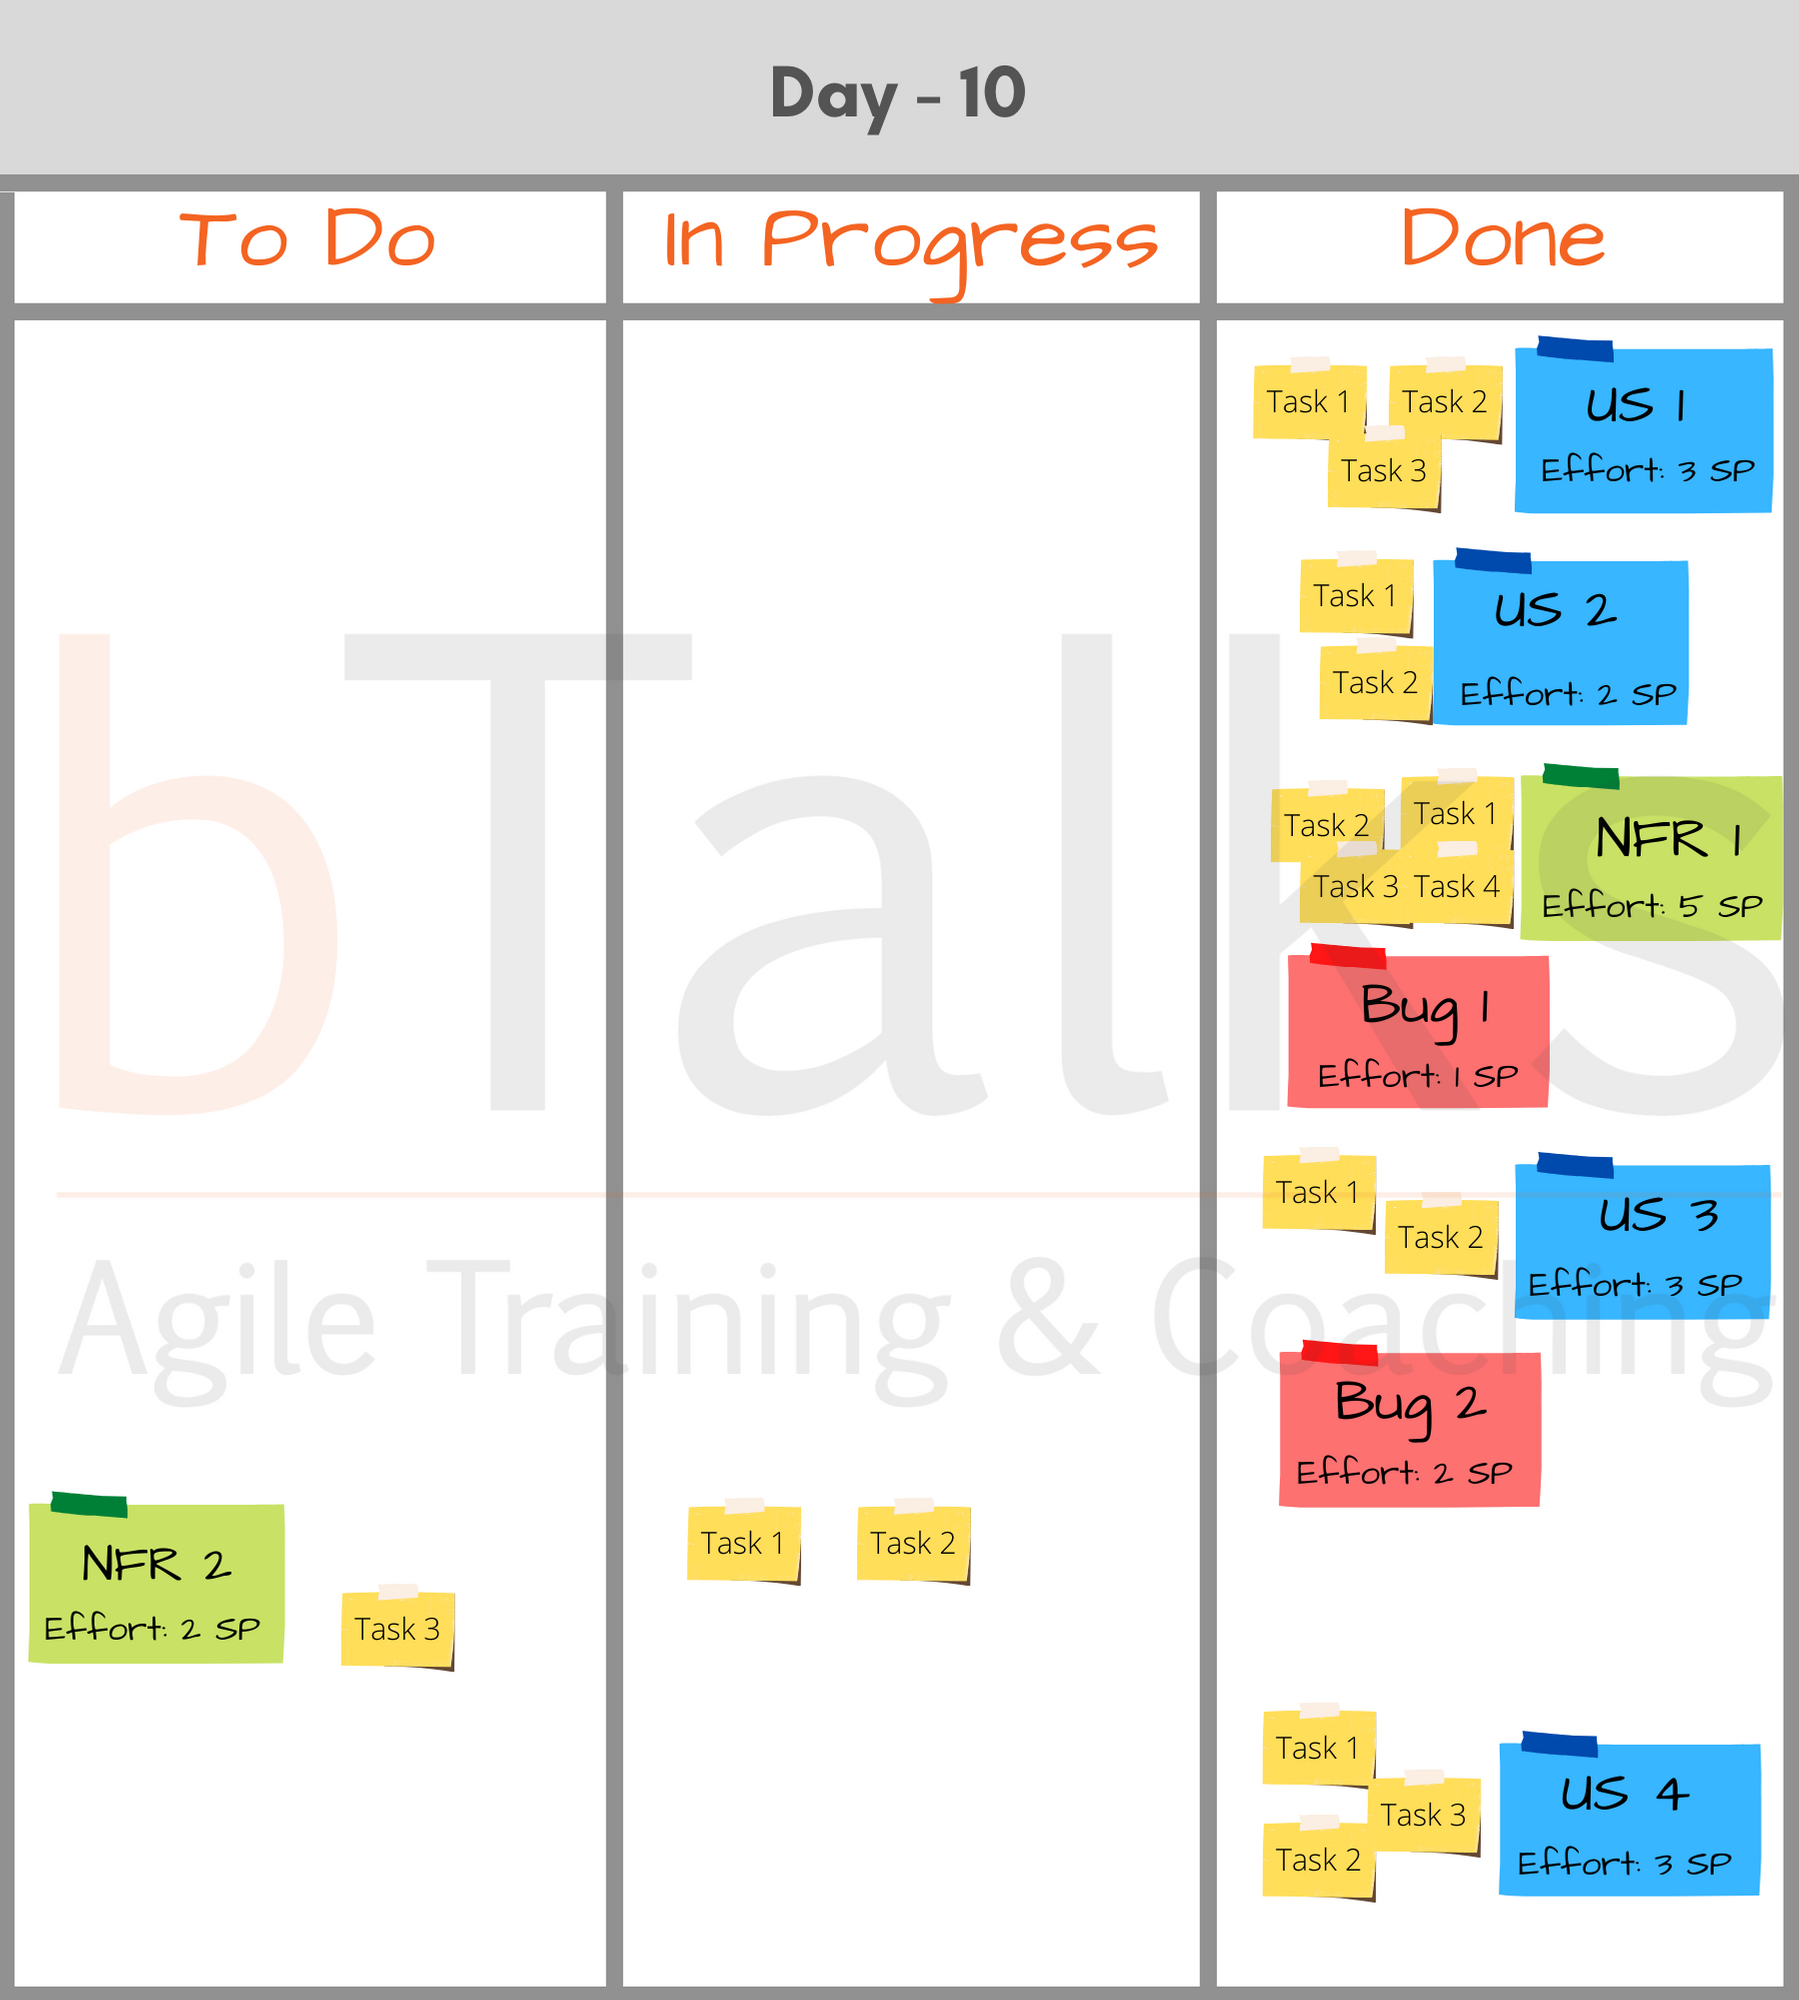
Day 10
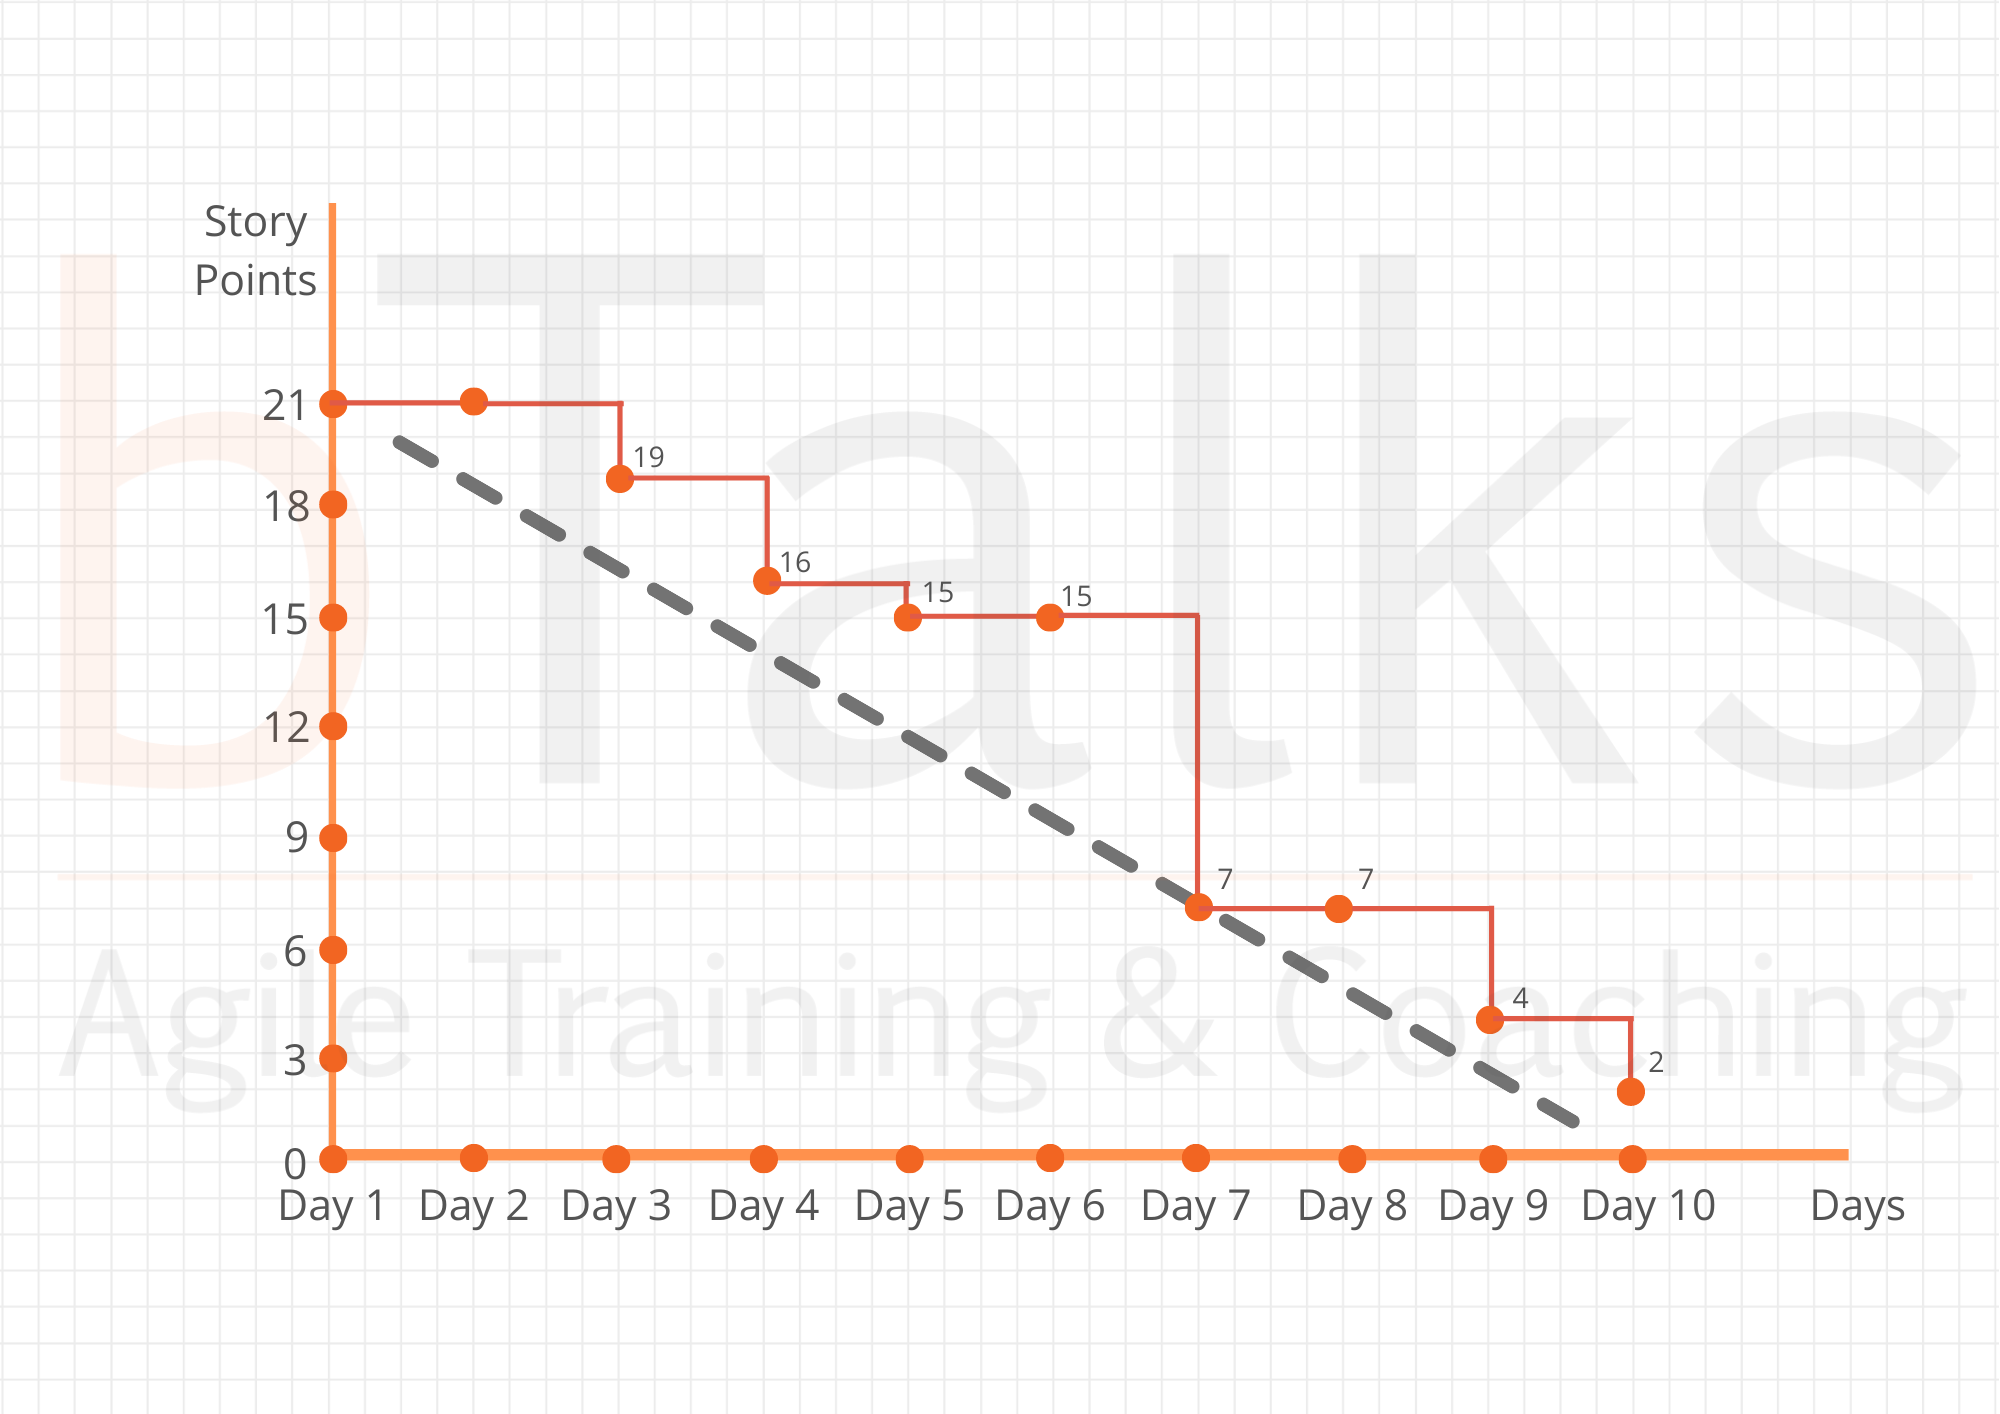

We can see that the team couldn't complete 2 Story Points in the last sprint.
What insights does a Burndown Chart give us and who is interested in this information?
This is a topic of our next blog posts, in which we will share how to analyze this chart.
If you don't want to miss it, subscribe for our newsletter. We regularly share how to apply useful Agile tools and techniques in your work. We also organize free Agile events every month. The topic of the next free event is "Adaptive Planning: Gain Predictability in Agile Environment - Mission Possible" on September 3, 2020. You can sign up for it here.
Този сайт използва бисквитки за аналитични цели, персонализирано съдържание и реклами. Ако продължите да го разглеждате, вие се съгласявате с използването на бисквитки.